Kaspa’s BTC Ratio Near Multi-Month Lows: What Traders Are Watching
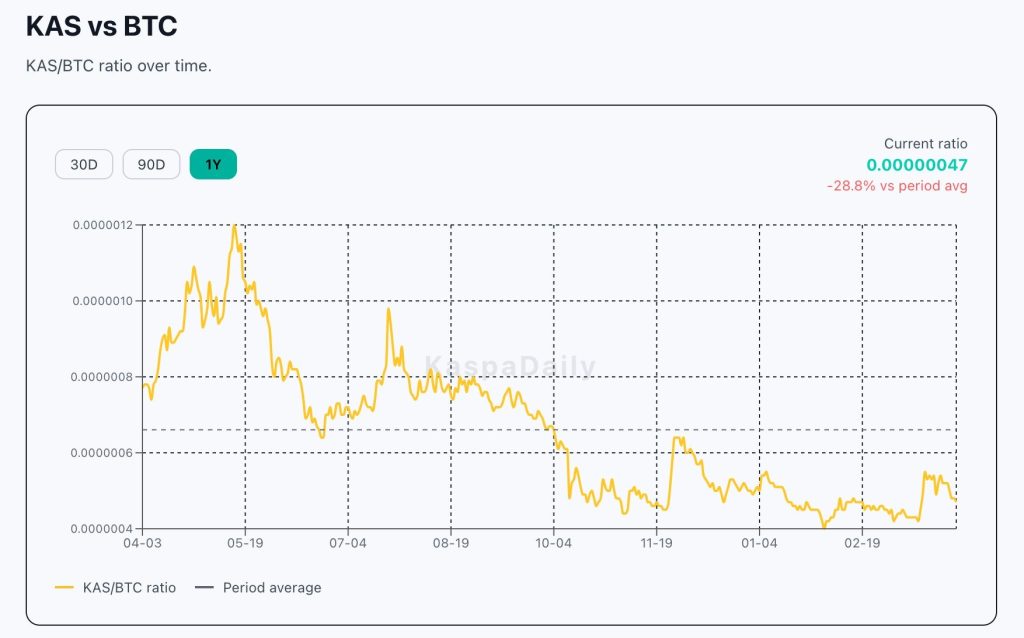
Kaspa has been losing ground to Bitcoin for months, and the data backs that up. The KAS/BTC ratio is sitting about 28.8% below its one-year average, which puts it right near the bottom of its range. In plain terms, Kaspa is about as cheap relative to Bitcoin as it’s been in a long time, and that’s exactly why traders are starting to pay attention.
Comparing KAS to BTC instead of just looking at its USD price gives you a cleaner picture of what’s actually going on. It tells you whether Kaspa is keeping up with Bitcoin or falling behind, regardless of what the broader market is doing.
And over the past year, the answer has mostly been the same, falling behind. There were a few short bursts where KAS showed some strength, but they didn’t last, and the overall trend has been pointing lower.
A Year of Ups and Downs for Kaspa
Looking at the chart shared by KaspaDaily, Kaspa actually got off to a decent start. In April and May 2025, the KAS/BTC ratio ran from around 0.00000077 up to 0.0000012 by mid-May, not bad at all, and a clear sign that Kaspa was holding its own against Bitcoin during that stretch.
The problem is it only lasted about six weeks. After that, the ratio dropped back down to around 0.00000065, and just like that, the momentum was gone.
 Source: X/@DailyKaspa
It got another chance in late July and early August, climbing back toward 0.00000098. But here’s the thing, that high was lower than the previous one. By October, that played out exactly as feared, with the ratio sliding to fresh lows around 0.00000045–0.00000048, the worst level of the entire year.
November brought a small bounce that briefly had people wondering if the bottom was in. It wasn’t. The move faded fast, and from December through February the ratio just kept drifting lower with barely any pushback from buyers. By February 2026, it had slipped all the way down to 0.00000040, a tough stretch with no real sign of life throughout.
Read Also: Kaspa (KAS) Puell Multiple Signals 3 Months of Miner Capitulation – What Comes Next
Why This Could Matter
When altcoins drop to multi-month lows against Bitcoin, they don’t always stay there. At some point, money starts rotating out of Bitcoin and back into alts, and assets sitting near the bottom of their range tend to be the first ones people look at.
Whether Kaspa is in that spot right now is the question. It might be a genuine accumulation zone, or Kaspa could keep drifting lower until something shifts the story. Either way, it’s worth watching.
Crypto has a way of moving in groups. When one layer-one token starts finding its footing against Bitcoin, the others in that space tend to notice, and before long, they’re moving too. So if Kaspa does start turning things around against BTC, it probably won’t stay isolated for long.
That kind of momentum has a way of spreading, lifting sentiment across similar projects and giving the broader ecosystem a bit of a pulse again.
Levels That Could Signal a KAS Move
The key level to watch on the upside is around 0.00000065, where the October breakdown happened. Climbing back above that would be the first clear sign that Kaspa is starting to regain ground against Bitcoin.
On the down side, if that ratio dips below the February low of 0.00000040, that’s a warning. It’d be a sign that Kaspa is still having trouble finding a bottom, and traders might start checking out other layer-one projects that look stronger in comparison.
Kaspa has been under pressure for close to a year now, but that doesn’t mean it stays that way forever. Multi-month lows against Bitcoin have historically been where patient traders start building positions, especially when an altcoin rotation looks like it could be around the corner.
Keeping tabs on the KAS/BTC ratio alongside what’s happening in the broader market could give traders a useful early signal before the rest of the crowd catches on.
Subscribe to our YouTube channel for daily crypto updates, market insights, and expert analysis.
The post Kaspa’s BTC Ratio Near Multi-Month Lows: What Traders Are Watching appeared first on CaptainAltcoin.


Ayrıca Şunları da Beğenebilirsiniz

edgeX (EDGE) Surges 44.9% to All-Time High: Volume Spike Analysis

Governor gives thousands of prisoners commutation hope for first time since 1990s