

This Hedera Signal Just Turned Green Again: Last Two Times HBAR Price Pumped 800% and 124%
In a boring market, Hedera managed a 4 percent pump in the last 24 hours. HBAR now trades around $0.09. The move caught attention, but one obscure chart signal suggests something bigger might be brewing.
Inca Investments, a relatively unknown account on X, posted a weekly MACD chart of HBAR. The pattern looks simple but carries historical weight.
HBAR Chart Analysis
The weekly MACD indicator just crossed bullish. The histogram bars turned green. That alone is not special. What makes it interesting is what happened the last two times this exact setup appeared.
In November 2024, the weekly MACD crossed with green histograms. The Hedera price proceeded to rally 800 percent over the following weeks.
In June 2025, the same signal flashed again. HBAR rallied 124 percent.
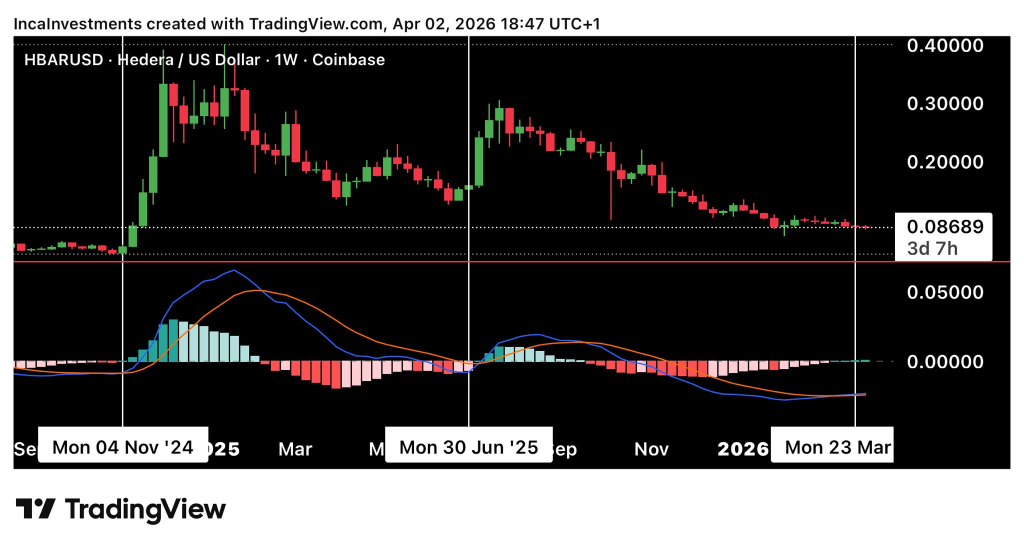 Source: X/@Incainvests
Now, in April 2026, the indicator is showing the same configuration. The MACD line is above the signal line. The histogram is printing green bars with growing momentum. The setup looks nearly identical to the two previous instances.
Read also: Analyst Ditches Bitcoin For Hedera: Why He’s All In On HBAR
Why Is This Signal Important for Hedera?
Weekly timeframes filter out noise. A MACD cross on the weekly chart carries more weight than a daily or hourly cross. The green histogram indicates that bullish momentum is increasing, not just starting to fade.
The previous two occurrences led to rallies of 800 percent and 124 percent. Those are not small bounces. They are sustained moves that lasted weeks or months. The 800 percent rally in late 2024 took HBAR from pennies to multi‑year highs.
The current price action shows the HBAR price holding above $0.085 and pushing toward $0.09. Volume is picking up, though still below the peaks seen during previous breakouts.
Overall, The signal is now active. For bulls, the key level is $0.10. A weekly close above that would confirm momentum is building. For bears, a drop back below the MACD trigger level would invalidate the setup.
Statistics, as Inca Investments pointed out, say yes. Two for two is not a huge sample size, but the pattern is clear. The chart does not guarantee a repeat, but it gives HBAR holders a reason to pay attention.
Subscribe to our YouTube channel for daily crypto updates, market insights, and expert analysis.
The post This Hedera Signal Just Turned Green Again: Last Two Times HBAR Price Pumped 800% and 124% appeared first on CaptainAltcoin.


Ayrıca Şunları da Beğenebilirsiniz
Pi network 2FA enforced for wallet users during first

Samsung Electronics Targets Record Q1 Profit as Memory Chip Supercycle Hits Full Stride


