Solana (SOL) Plunges Under $80 Amid Rising Geopolitical Concerns
Key Takeaways
- SOL declined 5.4% and broke beneath the $80 threshold as geopolitical uncertainty surrounding Iran escalated following Trump’s warnings
- Critical overhead resistance lies in the $82.22–$85.94 range; losing $78 support could trigger a descent toward $67
- Over $20 million in long positions were liquidated within a 24-hour window, indicating intensifying downward pressure
- The daily Relative Strength Index has fallen under 40, signaling strengthening bearish sentiment
- Technical analysts identify the $50–$60 zone as the next significant demand area should present support crumble
Solana (SOL) experienced a significant downturn during the last 24 hours, declining 5.4% and slipping beneath the $80 level as wider market sentiment deteriorated. The price decline was primarily fueled by escalating geopolitical concerns, particularly President Donald Trump’s statement threatening to strike Iran “extremely hard” in the upcoming weeks.
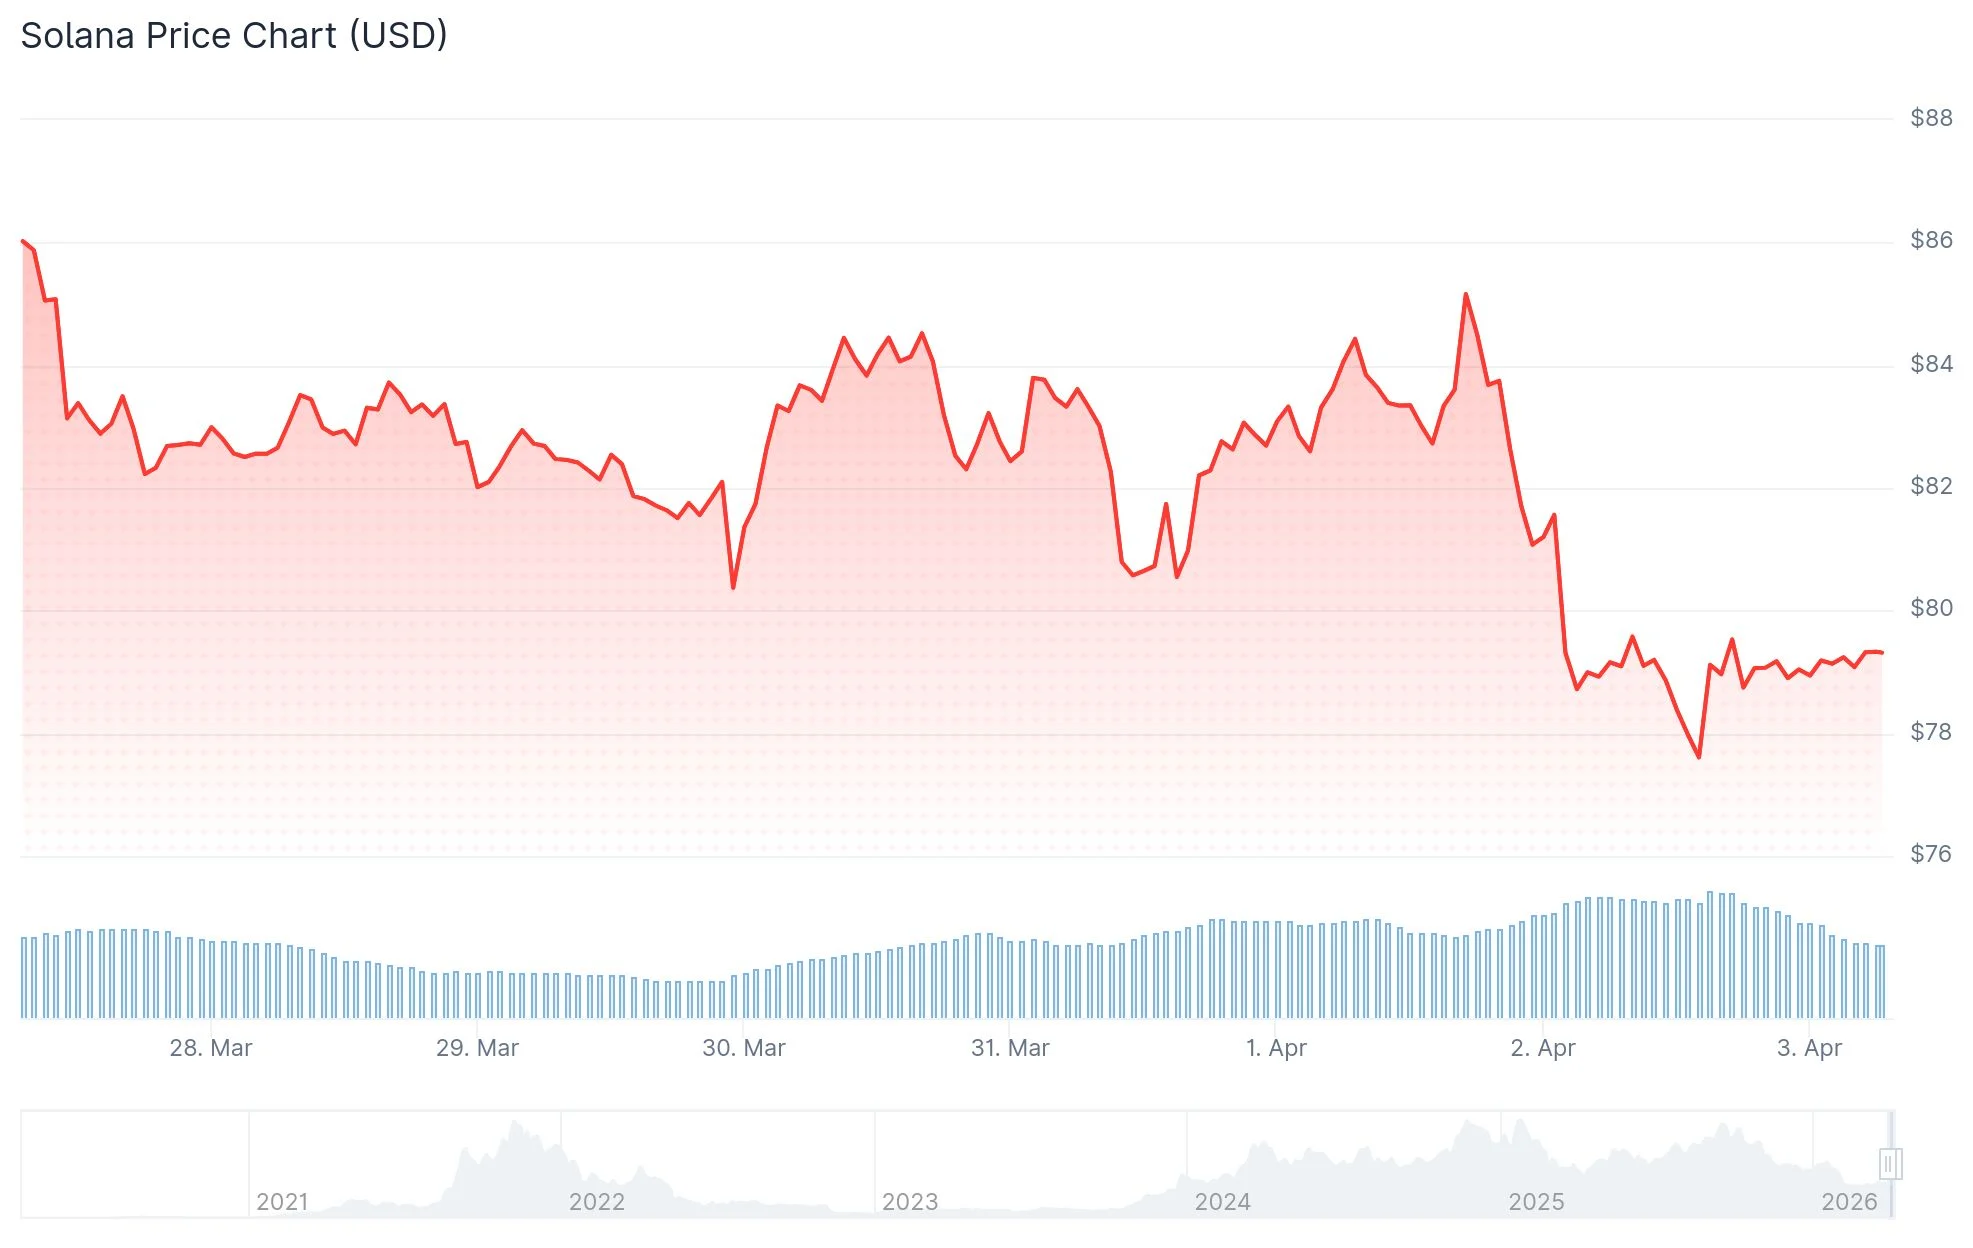 Solana (SOL) Price
Oil prices surged toward $110 in response to the announcement. This increase heightened worries about inflationary pressures and prompted market analysts to adjust their forecasts regarding Federal Reserve interest rate reductions in 2026. When expectations for rate cuts diminish, speculative assets such as cryptocurrencies typically face selling pressure.
Immediate overhead resistance is positioned between $82.22 and $85.94. This area encompasses multiple Fibonacci retracement levels including 23.6%, 38.2%, and 50.0%. Any attempt to rally into this zone may encounter renewed selling pressure without substantial buyer support.
Trading Volume Surge and Liquidation Data Point to Heavy Selling
Solana’s trading volume surged by 30% during the past 24 hours, climbing to approximately $6 billion, which represents roughly 13% of the token’s circulating market capitalization. This dramatic increase suggests substantial selling activity in the market.
Liquidations of long positions surpassed $20 million during this timeframe. Should this figure exceed $25 million, it would mark one of the most challenging sessions for Solana bulls since early February, when SOL tumbled from $100 down to $78.
The daily chart’s Relative Strength Index has dropped below the 40 threshold, a technical indicator that generally confirms strengthening bearish momentum. Additionally, three consecutive sell signals have emerged on the 4-hour timeframe, suggesting that institutional participants are actively reducing positions.
A breach of the $78 support threshold could pave the way for a move down to $67, which would represent approximately a 13% decline from present price levels.
Long-Term Technical Structure Suggests Further Downside
Examining the extended timeframe, analyst James Easton presented a 14-day chart illustrating SOL trading within a contracting descending channel. The technical pattern reveals a series of lower highs and lower lows since reaching its peak during late 2024 through early 2025.
Solana had maintained robust support within the $110 to $120 range. However, that zone has now converted into resistance territory. Market analysts indicate that inability to recapture the $100–$110 region maintains downside vulnerability, with $60 followed by $50 marked as the subsequent major accumulation zones.
Each rebound attempt has thus far been unable to disrupt the pattern of declining highs. With SOL long liquidations surpassing $20 million in just the past 24 hours, short sellers hold a tactical advantage should the $78 level fail to provide support.
The post Solana (SOL) Plunges Under $80 Amid Rising Geopolitical Concerns appeared first on Blockonomi.


Ayrıca Şunları da Beğenebilirsiniz

Stop Losing Sales in 2026: Build Better Funnels with Checkout Champ

Top Mistakes People Make When Choosing Web Hosting