TLDR Uniswap forms higher lows at key support zone, signaling potential recovery. UNI price drops 27.8% in 24 hours but remains resilient with strong liquidity. Open interest for UNI drops to $168M, clearing overleveraged positions. UNI holds $3.52B market cap, showing ongoing DeFi ecosystem strength. Uniswap (UNI) has recently shown signs of stabilization after a [...] The post Uniswap (UNI) Holds Key Support Zone as Traders Anticipate Trend Shift appeared first on CoinCentral.TLDR Uniswap forms higher lows at key support zone, signaling potential recovery. UNI price drops 27.8% in 24 hours but remains resilient with strong liquidity. Open interest for UNI drops to $168M, clearing overleveraged positions. UNI holds $3.52B market cap, showing ongoing DeFi ecosystem strength. Uniswap (UNI) has recently shown signs of stabilization after a [...] The post Uniswap (UNI) Holds Key Support Zone as Traders Anticipate Trend Shift appeared first on CoinCentral.

Uniswap (UNI) Holds Key Support Zone as Traders Anticipate Trend Shift

2025/10/12 18:29

TLDR

  • Uniswap forms higher lows at key support zone, signaling potential recovery.
  • UNI price drops 27.8% in 24 hours but remains resilient with strong liquidity.
  • Open interest for UNI drops to $168M, clearing overleveraged positions.
  • UNI holds $3.52B market cap, showing ongoing DeFi ecosystem strength.

Uniswap (UNI) has recently shown signs of stabilization after a sharp decline in its price, which saw it drop from over $8 to near $4. As the token consolidates within a key support zone, traders are closely watching for signals of a potential trend reversal. While the market has faced considerable volatility, Uniswap’s ability to maintain support levels offers cautious optimism for its next moves in the coming weeks.

Uniswap Finds Stability at Critical Support Zone

After a notable price drop, Uniswap has started to stabilize within a major demand zone. This area has historically acted as a strong support level, which has caught the attention of traders and investors. The coin’s ability to hold above this critical level despite continued market fluctuations suggests that a potential trend reversal may be in progress.

Accumulation Forms Around Key Support Zone

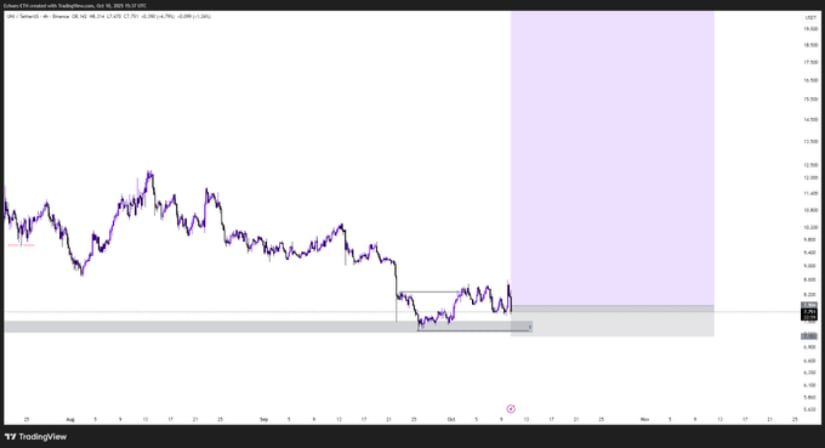
Analyst Yakov recently shared insights on X, noting that their dollar-cost-averaged (DCA) entry was made around $7.90. This price point aligns closely with the support zone where UNI has begun to form a series of higher lows and higher highs. These subtle patterns typically suggest that buying pressure may be picking up, offsetting the prior selling momentum. If this pattern persists, it could lay the groundwork for a more sustained recovery.

Market Activity Reflects Rebuilding Sentiment

Despite recent price volatility, Uniswap’s market activity has shown signs of resilience. At the time of writing, the token’s price was recorded at approximately $5.89, reflecting a 27.8% drop over the past 24 hours. This decline was driven in part by broader market stress and heavy liquidations. However, the overall market capitalization remains strong at $3.52 billion, with daily trading volumes of $1.29 billion.

Market Data Reflects Cautious Rebuilding

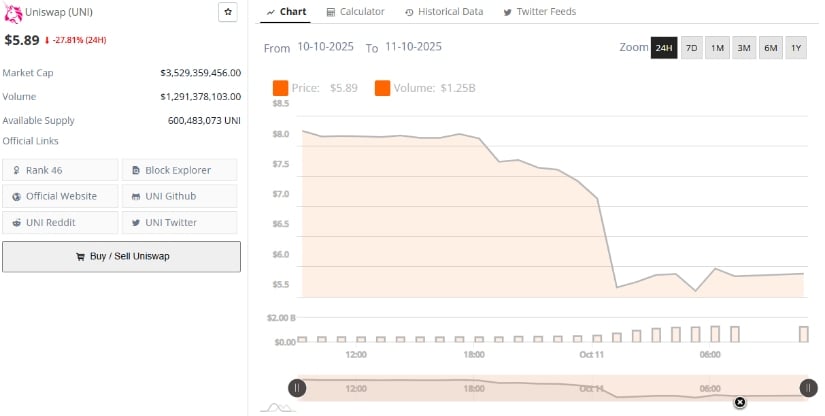
This data suggests that liquidity and trading participation remain intact despite the volatility. The coin continues to play a vital role in the decentralized finance (DeFi) space as the native token of the Uniswap protocol. This resilience provides a solid foundation for future growth, as the platform’s usage and fee generation remain stable even amidst uncertain market conditions.

Open Interest Drop Indicates Market Reset

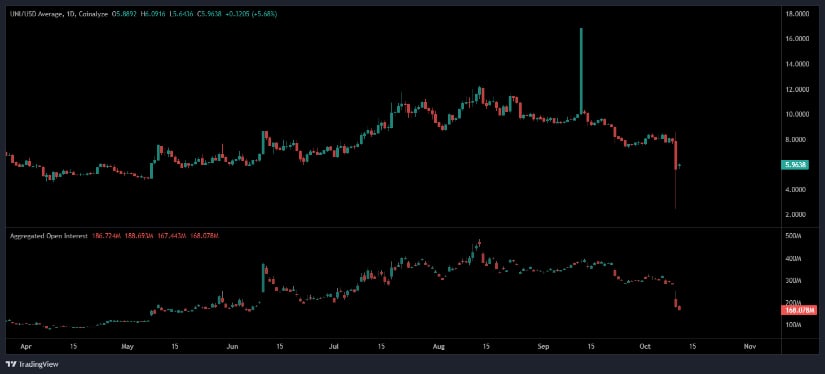
Open interest data for Uniswap has seen a substantial reduction, dropping to about $168 million in recent days. This decrease is viewed as a natural “cleansing phase” following the sharp market correction. The reduction in leverage suggests that overleveraged positions have been cleared, which can create a healthier market structure.

The drop in open interest also signals that speculative excess has been removed from the market, reducing the risk of further liquidations in case of volatility. With less leverage in play, traders are hopeful that price movements will be driven by organic demand and trading volumes, rather than by short-term speculative bets.

Outlook for Uniswap (UNI) in the Coming Weeks

As Uniswap stabilizes at key support levels, the attention now shifts to whether the price will maintain these levels or experience further declines. The coin’s ability to hold its ground amidst current market conditions offers hope for a possible trend reversal in the near future. If the pattern of higher lows continues, traders may view this as a signal that the market is ready for recovery.

Open Interest Data Signals a Market Reset

Given the reduction in open interest and the ongoing consolidation at support levels, Uniswap could see more stable price action in the coming weeks. With key factors like liquidity, governance participation, and DeFi activity continuing to anchor its value, UNI may be positioned for gradual recovery if the broader market conditions stabilize.

The post Uniswap (UNI) Holds Key Support Zone as Traders Anticipate Trend Shift appeared first on CoinCentral.

Disclaimer: The articles reposted on this site are sourced from public platforms and are provided for informational purposes only. They do not necessarily reflect the views of MEXC. All rights remain with the original authors. If you believe any content infringes on third-party rights, please contact service@support.mexc.com for removal. MEXC makes no guarantees regarding the accuracy, completeness, or timeliness of the content and is not responsible for any actions taken based on the information provided. The content does not constitute financial, legal, or other professional advice, nor should it be considered a recommendation or endorsement by MEXC.
Share Insights

You May Also Like

DOT – Vormt zich een PO3?

DOT – Vormt zich een PO3?

Introductie De koers van Polkadot (DOT) laat een klassiek PO3-marktmodel zien: Accumulation Manipulation Distribution. Deze drie fasen vormen samen het natuurlijke marktverloop waarin liquiditeit wordt opgebouwd, opgehaald en uiteindelijk uitbetaald in de volgende trendfase. DOT lijkt momenteel in de overgang te zitten van de manipulatiefase richting de potentiële distributiefase, een fase waarin de koers vaak snel en explosief kan stijgen. Accumulation DOT heeft gedurende een lange periode tussen ongeveer $3.5 en $12 gehandeld. Deze range heeft zich ontwikkeld tot een duidelijke accumulation zone, waarin grote marktspelers langzaam hun posities opbouwen.Tijdens deze fase zagen we herhaaldelijk dezelfde bovenzijde en onderzijde worden getest zonder structurele doorbraak. Zulke langdurige accumulatieperiodes zijn typisch voor markten die hun bodemfase vormen voordat een nieuwe grote trend zich ontplooit. De prijs beweegt dan zijwaarts, met weinig volatiliteit, terwijl de supply in stille handen verdwijnt. Manipulation Na de accumulationfase volgt vaak een manipulatiefase. In deze fase breekt de prijs onder de rangebodem, om de liquiditeit op te halen van traders die long zaten of hun stops te dicht onder de bodem hadden geplaatst.DOT liet exact dit gedrag zien: een diepe uitschieter naar beneden onder de $3 zone, wat overeenkomt met een liquiditeitsjacht op de lows. Hoewel deze beweging extreem was, blijft het concept hetzelfde, de markt jaagt op liquiditeit voordat een sterke tegenbeweging kan ontstaan. Deze neerwaartse spike vormt dus mogelijk de final shake-out van de lagere tijdframes. Distribution Op dit moment lijkt de manipulatiefase nog niet volledig voltooid. DOT beweegt nog steeds rond de onderkant van de range en bouwt langzaam opnieuw structuur op.Zodra de markt stabiliseert, volgt meestal de distributiefase omhoog, dit is het moment waarop veel marktdeelnemers hun vertrouwen hebben verloren in een bullmarket. Juist in die fase ontstaat vaak een krachtige stijging, aangedreven door de eerder verzamelde liquiditeit uit de accumulation- en manipulation fasen.De distributie leidt vaak tot een explosieve expansie omhoog, waarbij de markt oude ranges doorbreekt en snel richting hogere niveaus beweegt. Target Het eerste belangrijke target voor DOT in de aankomende distributiefase ligt rond de highs van de accumulation range, tussen $10 en $12.Dit gebied valt samen met de golden pocket resistance (0.618–0.65 Fibonacci retracement), wat het een technisch sterke zone maakt waar winstnemingen te verwachten zijn.Mocht DOT erin slagen deze zone te doorbreken met krachtig volume, dan opent dat de weg voor een langdurigere uptrend richting hogere timeframes. Het bericht DOT – Vormt zich een PO3? is geschreven door Youri Oosterveen en verscheen als eerst op Bitcoinmagazine.nl.
Share
Coinstats2025/10/12 19:31
Share