

Evaluating Instance-Incremental Learning: CIL Methods on Cifar-100 and ImageNet
Table of Links
Abstract and 1 Introduction
-
Related works
-
Problem setting
-
Methodology
4.1. Decision boundary-aware distillation
4.2. Knowledge consolidation
-
Experimental results and 5.1. Experiment Setup
5.2. Comparison with SOTA methods
5.3. Ablation study
-
Conclusion and future work and References
\
Supplementary Material
- Details of the theoretical analysis on KCEMA mechanism in IIL
- Algorithm overview
- Dataset details
- Implementation details
- Visualization of dusted input images
- More experimental results
5. Experimental results
We reorganize the training set of some existing datasets that are commonly used in the class-incremental learning to establish the benchmarks. Implementation details of our experiments can be found in the supplementary material.
5.1. Experiment Setup
5.1.1 Datasets
\ 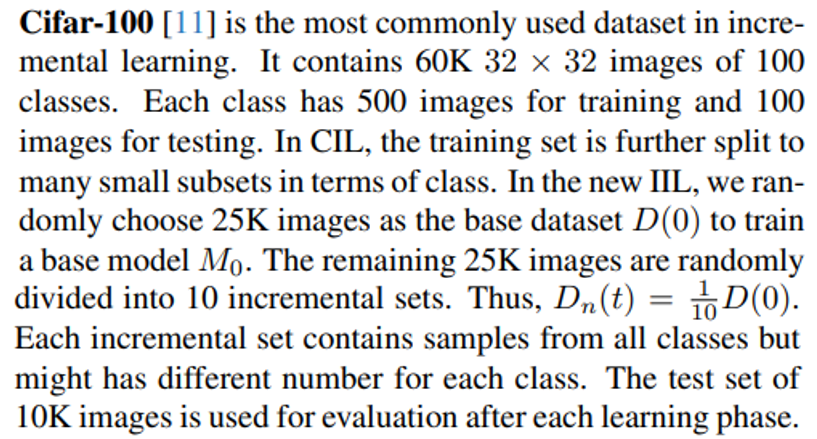
\ 
\ 
\ ImageNet [24] is another dataset that commonly used. The ImageNet-1000 which consists of 1.2 million training images and 150K testing images from 1000 classes. Following Douillard et al. [4, 6], we randomly select 100 classes (ImageNet-100) and split it into 1 base set with half of the training images and 10 incremental sets with another half of images as we do on Cifar-100.
\ Entity-30 included in BREEDS datasets [25] simulates the real-world sub-population shifting. For example, the base model learns the concept of dog with photos of “Poodles”, but on incremental data it has to extend the “dog” concept to “Terriers” or “Dalmatians”. Entity-30 has 240 subclasses with a large data size. As the sub-population shifting is a specific case of the instance-level concept drift, we evaluate the proposed method on Entity-30 following the setting of ISL [13].
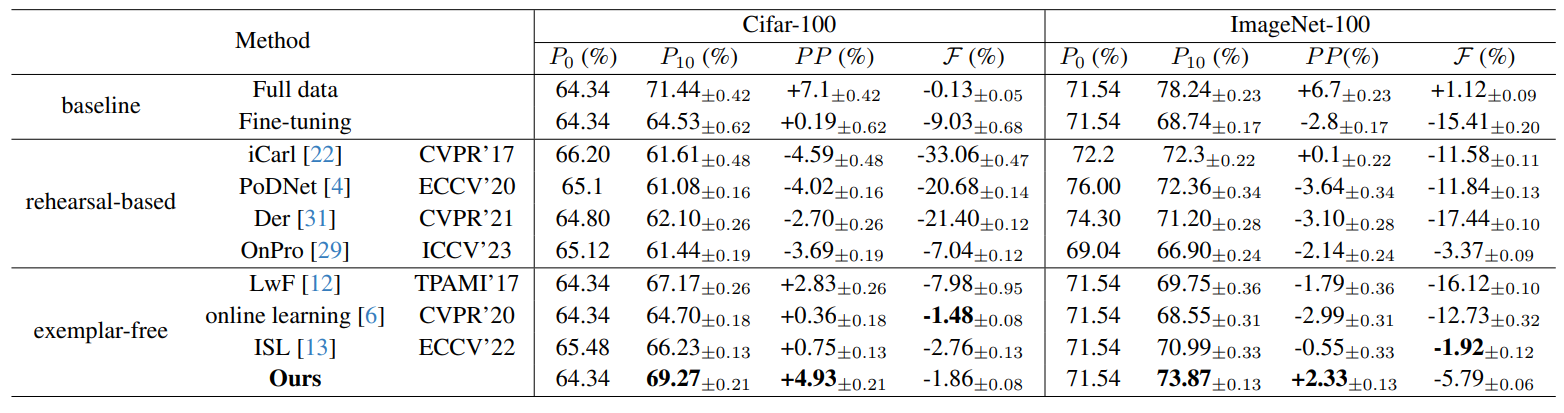
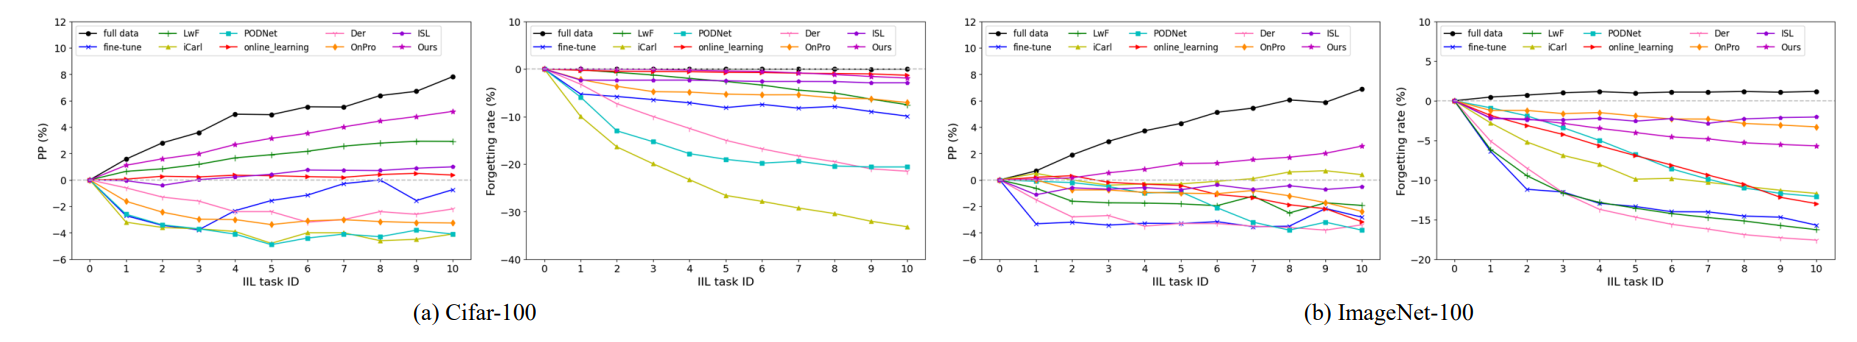
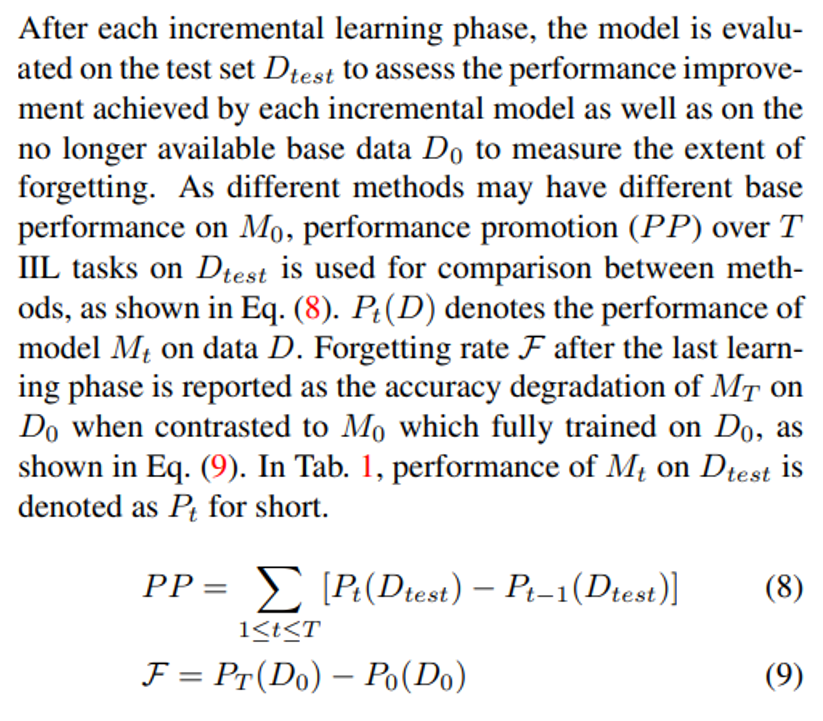
\ 5.1.2 Evaluation metrics
\ 
\ 5.1.3 Evaluated baselines
\ As few existing method is proposed for the IIL setting, we reproduce several classic and SOTA CIL methods by referring to their original code or paper with the minimum revision, including iCarl [22] and LwF [12] which utilize labellevel distillation, PODNet [4] which implements distillation at the feature level, Der [31] which expends the network dynamically and attains the best CIL results, OnPro [29] which uses online prototypes to enhance the existing boundaries, and online learning [6] which can be applied to the hybrid-incremental learning. ISL [13] proposed for incremental sub-population learning is the only method that can be directly implemented in the new IIL setting. As most CIL methods require old exemplars, to compare with them, we additionally set a memory of 20 exemplars per class for these methods. We aim to provide a fair and comprehensive comparison in the new IIL scenario. Details of reproducing these methods can be found in our supp. material.
\ 
\
:::info Authors:
(1) Qiang Nie, Hong Kong University of Science and Technology (Guangzhou);
(2) Weifu Fu, Tencent Youtu Lab;
(3) Yuhuan Lin, Tencent Youtu Lab;
(4) Jialin Li, Tencent Youtu Lab;
(5) Yifeng Zhou, Tencent Youtu Lab;
(6) Yong Liu, Tencent Youtu Lab;
(7) Qiang Nie, Hong Kong University of Science and Technology (Guangzhou);
(8) Chengjie Wang, Tencent Youtu Lab.
:::
:::info This paper is available on arxiv under CC BY-NC-ND 4.0 Deed (Attribution-Noncommercial-Noderivs 4.0 International) license.
:::
\
You May Also Like

U.S. Oil Production Is On Pace For A New Record, But Growth Is Slowing

Hester Peirce Clarifies No Endorsement of OpenVPP Despite Meeting
