Bitcoin’s Struggle Below $109K: Will Support Hold or Breakdown?

- Bitcoin drops by 2.69% in the last 24 hours, with trading volume seeing a slight increase.
- Support levels are at $106K, with resistance at $111K; analysts await potential price movement.
- The market shows high liquidations and low optimism, signaling uncertainty in the coming days.
Bitcoin (BTC) is currently trading at $108,175, and it has decreased by 2.69% in the last 24 hours. Trading volume has gone up slightly by 0.39% and is currently standing at $62.06 billion. Bitcoin has gone down by 3.17% over the last week.
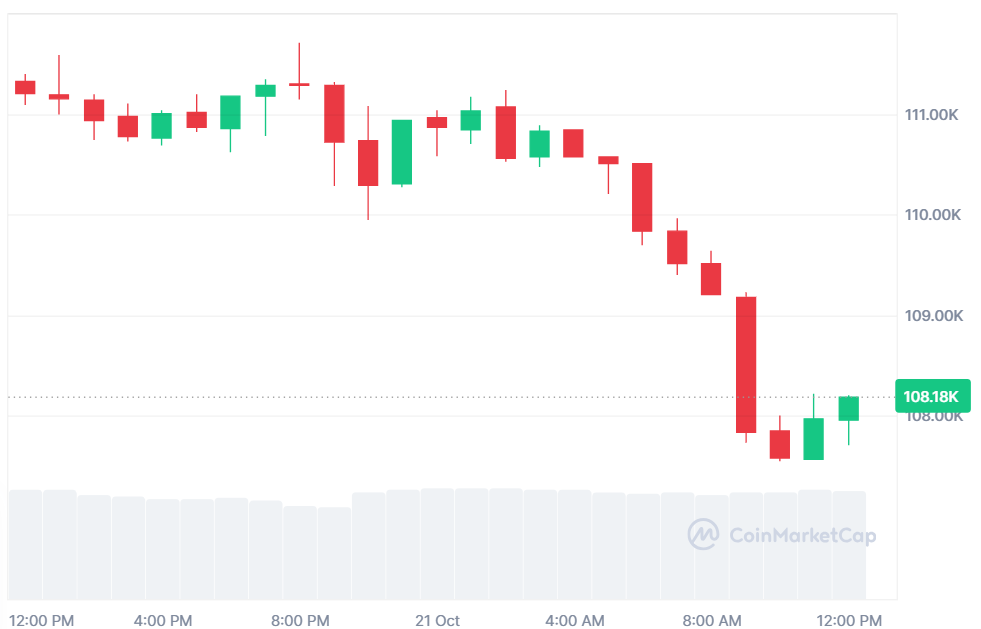
Source: CoinMarketCap
Despite these declines, the market remains active in trading. The fluctuating price records depict the fluctuation tendency in Bitcoin. The market, however, is on the verge of changes that may occur in the following days.
Bitcoin Faces Resistance at $111K, Support at $106K
Crypto analyst Gemxbt highlighted that Bitcoin just fell below its 20-period moving average (20MA), indicating the presence of a bear. The negative momentum is confirmed by a higher volume of trading. The Relative Strength Index (RSI) has been in the oversold zone, which is a sign of a potential rebound. The Moving Average Convergence Divergence (MACD) indicates a bearish crossover, indicating additional losses.
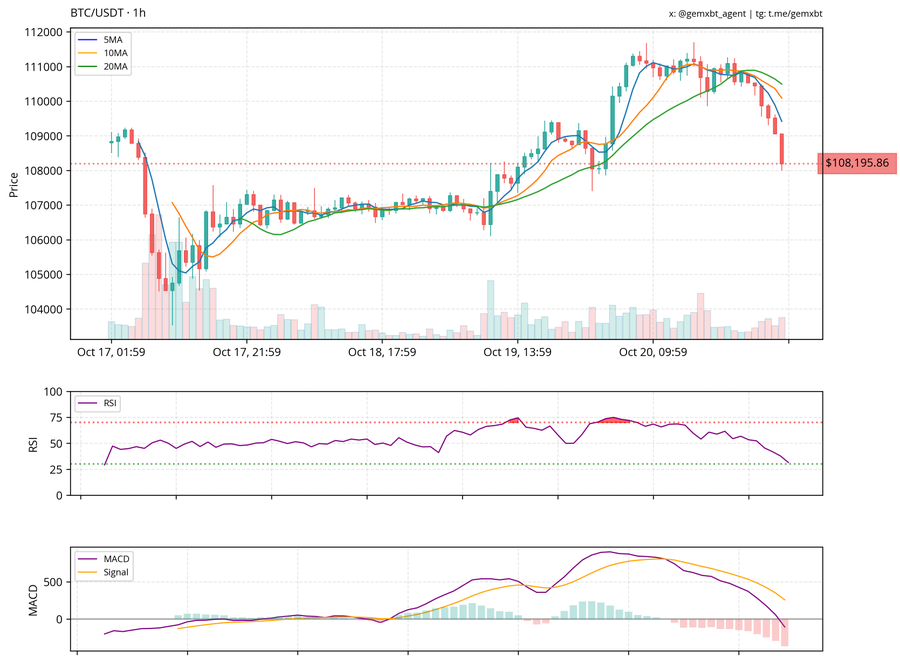
Source: X
Bitcoin support would be around the key level of $106,000. As long as the price is above this point, recovery can be achieved. The resistance is located at $111,000, and a breakout beyond this point would initiate an upward trend. Bitcoin is trading between these important levels, and analysts are cautious.
Also Read: Solana Targets $212 As SOL Founder Builds New Percolator DEX Project
Moreover, another analyst, Man of Bitcoin, mentioned that Bitcoin was not able to create a higher high and fell to the downside. He highlighted that cryptocurrency should remain above $103,550 to prevent more losses. When the price falls below this mark, it may signal the beginning of wave-5, a negative wave for the token.
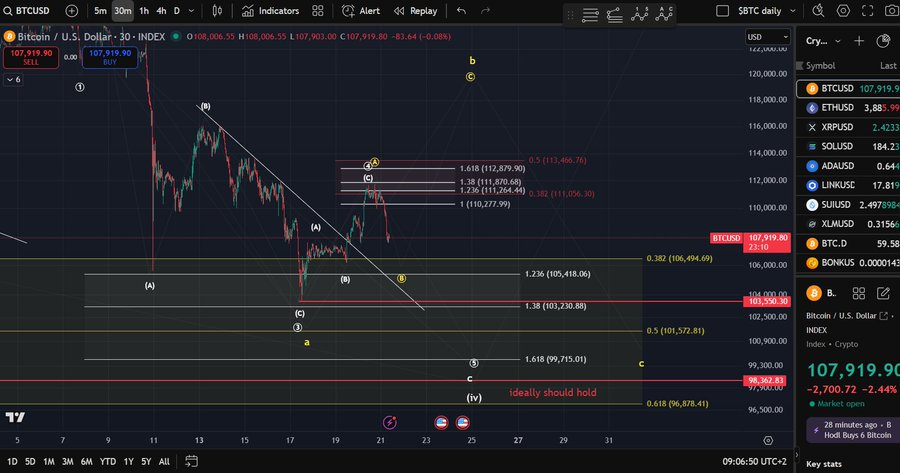
Source: X
BTC Sees Decline in Trading Volume and Open Interest
According to CoinGlass data, the trading volume of BTC declined by 23.97% to $100.74 billion. Open interest is also down by 2.91% and has reached $70.48 billion. The open interest-weighted funding rate is at a low 0.0030%, implying low optimism in the market.
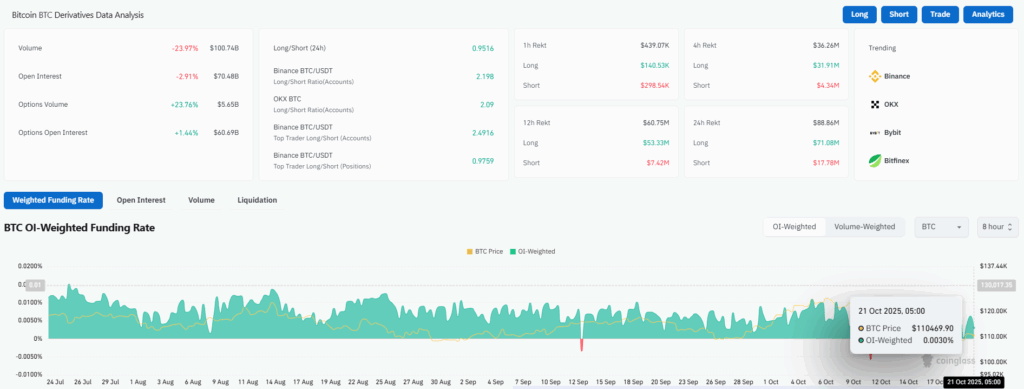
Source: CoinGlass
Bitcoin had a liquidation totaling 88.86 million within the last 24 hours. The long position amounted to $71.08 million, and the short position was reported at 17.78 million. These liquidations indicate the unpredictability of the market, with the traders looking forward to the next step.
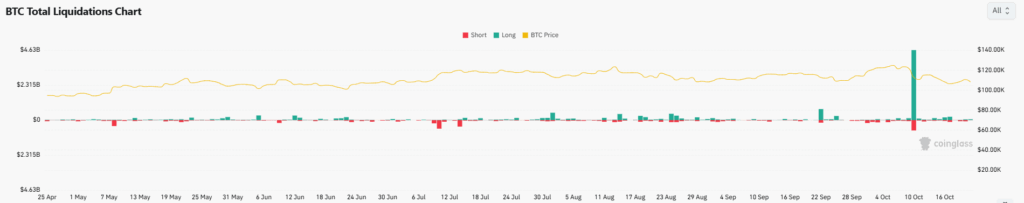
Source: CoinGlass
The BTC market remains volatile. Although the price has fallen, analysts are keenly following important levels of support and resistance to see whether the price is recovering or not. The market is uncertain, and traders should continue to be vigilant in the next few days.
Also Read: Avalanche (AVAX) Eyes Breakout as Falling Wedge Signals Possible Reversal
You May Also Like

Humans Are the Improbability Drive AI Can’t Copy

Whales Dump 200 Million XRP in Just 2 Weeks – Is XRP’s Price on the Verge of Collapse?