Bitcoin Price Slips In Choppy Trade As Bears Tighten Grip
Bitcoin price corrected gains and tested the $66,000 support. BTC is now consolidating losses and might decline further below the $65,500 zone.
- Bitcoin is struggling to recover losses and moving lower below $67,200.
- The price is trading below $67,200 and the 100 hourly simple moving average.
- There is a declining channel forming with resistance at $68,000 on the hourly chart of the BTC/USD pair (data feed from Kraken).
- The pair might dip again if it trades below the $66,000 and $65,500 levels.
Bitcoin Price Dips Again
Bitcoin price failed to remain stable above the $68,000 zone. BTC started a fresh decline and traded below the $67,500 support zone. There was a push below $67,000.
The price dipped below the 76.4% Fib retracement level of the upward move from the $65,072 swing low to the $70,935 high. Finally, the price found some support near the $66,000 zone. It is now consolidating losses and there is a declining channel forming with resistance at $68,000 on the hourly chart of the BTC/USD pair.
Bitcoin is now trading below $67,200 and the 100 hourly simple moving average. If the price remains stable above $66,000, it could attempt a fresh increase. Immediate resistance is near the $67,350 level.
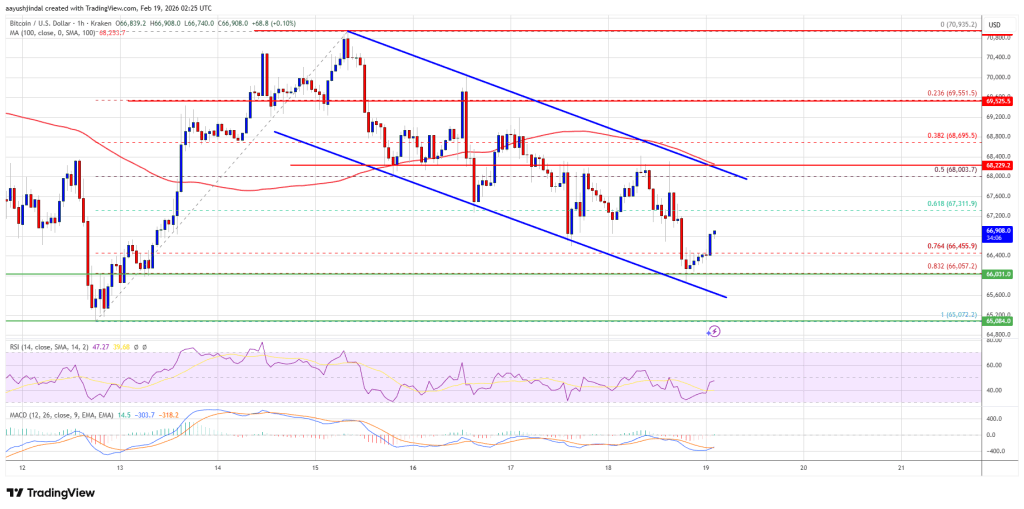
The first key resistance is near the $68,000 level. A close above the $68,000 resistance might send the price further higher. In the stated case, the price could rise and test the $68,800 resistance. Any more gains might send the price toward the $69,500 level. The next barrier for the bulls could be $70,000 and $70,500.
More Losses In BTC?
If Bitcoin fails to rise above the $68,000 resistance zone, it could start another decline. Immediate support is near the $66,000 level or the 83.2% Fib retracement level of the upward move from the $65,072 swing low to the $70,935 high. The first major support is near the $65,500 level.
The next support is now near the $65,000 zone. Any more losses might send the price toward the $64,200 support in the near term. The main support now sits at $63,500, below which BTC might struggle to recover in the near term.
Technical indicators:
Hourly MACD – The MACD is now gaining pace in the bearish zone.
Hourly RSI (Relative Strength Index) – The RSI for BTC/USD is now below the 50 level.
Major Support Levels – $66,000, followed by $65,000.
Major Resistance Levels – $67,350 and $68,000.
You May Also Like

Humans Are the Improbability Drive AI Can’t Copy

Top 5 Crypto Jurisdictions in 2026 from Offshore to Onshore