Mixed signals across the crypto assets amid extreme fear sentiment reflect typical market uncertainty. The broader bearish presence has caused the largest tokensMixed signals across the crypto assets amid extreme fear sentiment reflect typical market uncertainty. The broader bearish presence has caused the largest tokens

World Liberty Financial (WLFI) Posts 18% Surge: Are Buyers Taking the Driver’s Seat?

2026/02/18 15:24
3 min read
  • World Liberty Financial trades at $0.11 after a 18% jump.
  • WLFI’s daily trading volume has exploded by over 109%.

Mixed signals across the crypto assets amid extreme fear sentiment reflect typical market uncertainty. The broader bearish presence has caused the largest tokens, including Bitcoin (BTC) and Ethereum (ETH), to hover under the red radar. Meanwhile, World Liberty Financial (WLFI) has defied the overall market tide by registering a steady 18.73% surge in value. 

The asset opened the day trading at a bottom of $0.09926, and with the gradual bullish encounter, the price has been pushed up to a high range of $0.1167. If this recent jump gains further traction, the bulls would strengthen the move on the upside and help the price to escape all the bearish traits on the chart.

At the time of writing, World Liberty Financial trades at around $0.1185, with its market cap reaching $3.16 billion. Besides, the daily trading volume of the asset has skyrocketed by over 109%, touching $234.26 million. As per Coinglass data, the WLFI market has seen a $1.15 million liquidation during the last 24 hours.

World Liberty Financial’s 4-hour price chart reveals that the bullish pressure is building. If the price could climb and test the resistance at around $0.12, the bulls might trigger the golden cross to unfold. Later, it sends the price toward $0.13. 

Conversely, a bearish shift could make the World Liberty Financial price retrace to the $0.10 support. An extended correction on the downside might strengthen the bears, and the death cross would potentially take place, driving the price even lower.

Indicators Point to Growing Momentum in World Liberty Financial

World Liberty Financial’s MACD line is above the zero line, indicating the short-term average is above the long-term average, reflecting bullish bias. The signal line remains below zero, showing the developing momentum. A stronger uptrend occurs if the MACD crosses above the signal line and both move into positive territory. 

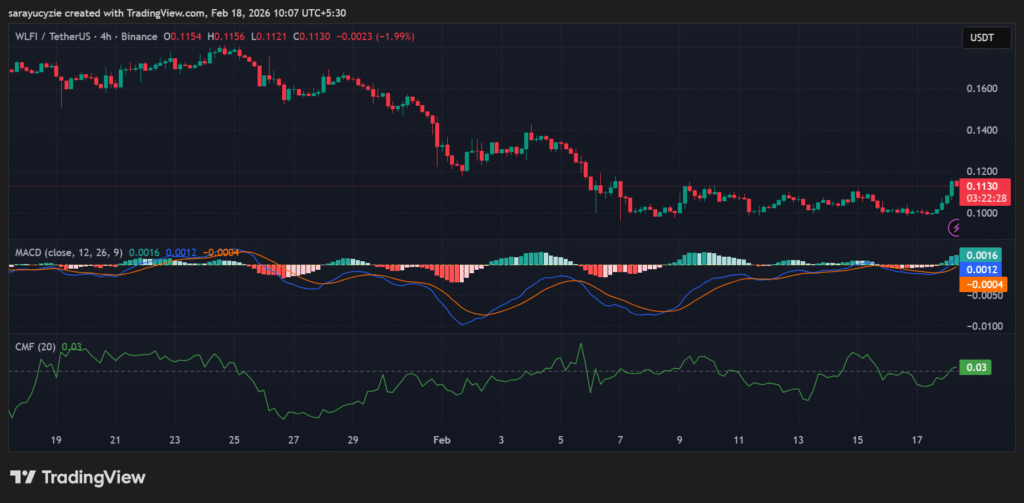
WLFI chart (Source: TradingView)

In addition, the Chaikin Money Flow (CMF) indicator is used to gauge the strength behind the price move by tracking the capital flow. It is settled at 0.03 suggests slight buying pressure in the WLFI market. As it is above zero, the capital is flowing into the asset, with mild bullish sentiment. Notably, the broader strength is weak.

The current market sentiment of World Liberty Financial is strongly bullish, with the daily Relative Strength Index (RSI) value of 64.17. The buyers are in control, and there is still room to move up for it to enter the overbought territory. Moreover, WLFI’s Bull Bear Power (BBP) reading is positioned at 0.0161, implying a slight bullish dominance. Significantly, the bulls have a modest advantage over the bears, but the active momentum is not strong yet.

Top Updated Crypto News

Stablecoins are Gaining Edge in the Asian Market When Cryptocurrencies are Experiencing Volatility

Market Opportunity
WLFI Logo
WLFI Price(WLFI)
$0.1161
$0.1161$0.1161
0.00%
USD
WLFI (WLFI) Live Price Chart
Disclaimer: The articles reposted on this site are sourced from public platforms and are provided for informational purposes only. They do not necessarily reflect the views of MEXC. All rights remain with the original authors. If you believe any content infringes on third-party rights, please contact service@support.mexc.com for removal. MEXC makes no guarantees regarding the accuracy, completeness, or timeliness of the content and is not responsible for any actions taken based on the information provided. The content does not constitute financial, legal, or other professional advice, nor should it be considered a recommendation or endorsement by MEXC.

You May Also Like

U.S. Supreme Court's decision on Trump's tariffs may not rock crypto — yet

U.S. Supreme Court's decision on Trump's tariffs may not rock crypto — yet

News Analysis Share Share this article
Copy linkX (Twitter)LinkedInFacebookEmail
U.S. Supreme Court's decision on Trump
Share
Coindesk2026/02/21 02:42
Whales Dump 200 Million XRP in Just 2 Weeks – Is XRP’s Price on the Verge of Collapse?

Whales Dump 200 Million XRP in Just 2 Weeks – Is XRP’s Price on the Verge of Collapse?

Whales offload 200 million XRP leaving market uncertainty behind. XRP faces potential collapse as whales drive major price shifts. Is XRP’s future in danger after massive sell-off by whales? XRP’s price has been under intense pressure recently as whales reportedly offloaded a staggering 200 million XRP over the past two weeks. This massive sell-off has raised alarms across the cryptocurrency community, as many wonder if the market is on the brink of collapse or just undergoing a temporary correction. According to crypto analyst Ali (@ali_charts), this surge in whale activity correlates directly with the price fluctuations seen in the past few weeks. XRP experienced a sharp spike in late July and early August, but the price quickly reversed as whales began to sell their holdings in large quantities. The increased volume during this period highlights the intensity of the sell-off, leaving many traders to question the future of XRP’s value. Whales have offloaded around 200 million $XRP in the last two weeks! pic.twitter.com/MiSQPpDwZM — Ali (@ali_charts) September 17, 2025 Also Read: Shiba Inu’s Price Is at a Tipping Point: Will It Break or Crash Soon? Can XRP Recover or Is a Bigger Decline Ahead? As the market absorbs the effects of the whale offload, technical indicators suggest that XRP may be facing a period of consolidation. The Relative Strength Index (RSI), currently sitting at 53.05, signals a neutral market stance, indicating that XRP could move in either direction. This leaves traders uncertain whether the XRP will break above its current resistance levels or continue to fall as more whales sell off their holdings. Source: Tradingview Additionally, the Bollinger Bands, suggest that XRP is nearing the upper limits of its range. This often points to a potential slowdown or pullback in price, further raising concerns about the future direction of the XRP. With the price currently around $3.02, many are questioning whether XRP can regain its footing or if it will continue to decline. The Aftermath of Whale Activity: Is XRP’s Future in Danger? Despite the large sell-off, XRP is not yet showing signs of total collapse. However, the market remains fragile, and the price is likely to remain volatile in the coming days. With whales continuing to influence price movements, many investors are watching closely to see if this trend will reverse or intensify. The coming weeks will be critical for determining whether XRP can stabilize or face further declines. The combination of whale offloading and technical indicators suggest that XRP’s price is at a crossroads. Traders and investors alike are waiting for clear signals to determine if the XRP will bounce back or continue its downward trajectory. Also Read: Metaplanet’s Bold Move: $15M U.S. Subsidiary to Supercharge Bitcoin Strategy The post Whales Dump 200 Million XRP in Just 2 Weeks – Is XRP’s Price on the Verge of Collapse? appeared first on 36Crypto.
Share
Coinstats2025/09/17 23:42
“A Property Is More Than Just Square Meters”: How a Systematic Approach Is Changing the Profitability of Commercial Real Estate

“A Property Is More Than Just Square Meters”: How a Systematic Approach Is Changing the Profitability of Commercial Real Estate

Andrey Kononenko On Commercial Real Estate Management, The Kazakhstan Market, And Why Practitioners Need Science Andrey Kononenko began his career the same way
Share
Techbullion2026/02/21 02:02