Bitcoin price is hovering around $68,500 as traders watch for potential volatility around Chinese New Year, a period that has historically coincided with short-Bitcoin price is hovering around $68,500 as traders watch for potential volatility around Chinese New Year, a period that has historically coincided with short-

Bitcoin price prediction: Will Chinese New Year trigger a BTC selloff tomorrow?

2026/02/16 14:53
3 min read

Bitcoin price is hovering around $68,500 as traders watch for potential volatility around Chinese New Year, a period that has historically coincided with short-term shifts in crypto liquidity.

Summary
  • Bitcoin is trading around $68,500 ahead of Chinese New Year, a period that has historically seen mixed crypto performance, with some years showing pre-holiday weakness.
  • Coinbase CEO Brian Armstrong said retail users are “buying the dip,” with February BTC and ETH balances equal to or higher than December levels.
  • Technically, BTC remains below its 50-day SMA near $83,900, with support at $65,000 and $60,000–$62,000, and resistance around $72,000 and $76,000–$80,000.

Chinese New Year effect — seasonal pressure or coincidence?

Chinese New Year has at times aligned with weakness in Bitcoin (BTC) and broader crypto markets.

The theory is that traders in Asia may reduce exposure ahead of the holiday to free up cash, leading to temporary selling pressure. In some past cycles, BTC saw pullbacks in the days leading into Lunar New Year.

However, the pattern is far from consistent. There have also been years where Bitcoin rallied shortly after the holiday period. Crypto markets today are also more globally distributed than in earlier cycles, reducing the likelihood that one regional holiday alone drives price direction.

Adding another layer, Coinbase CEO Brian Armstrong recently said retail users on the exchange are “buying the dip.”

According to his data, retail BTC and ETH balances in February are equal to or higher than December levels, suggesting long-term holders are accumulating rather than capitulating.

If that trend holds, it could cushion any seasonal selling.

What Bitcoin price analysis shows

On the daily chart, BTC remains below its 50-day simple moving average near $83,900, confirming that the short-term trend is still bearish.

Bitcoin price prediction: Will Chinese New Year trigger a BTC selloff tomorrow? - 1

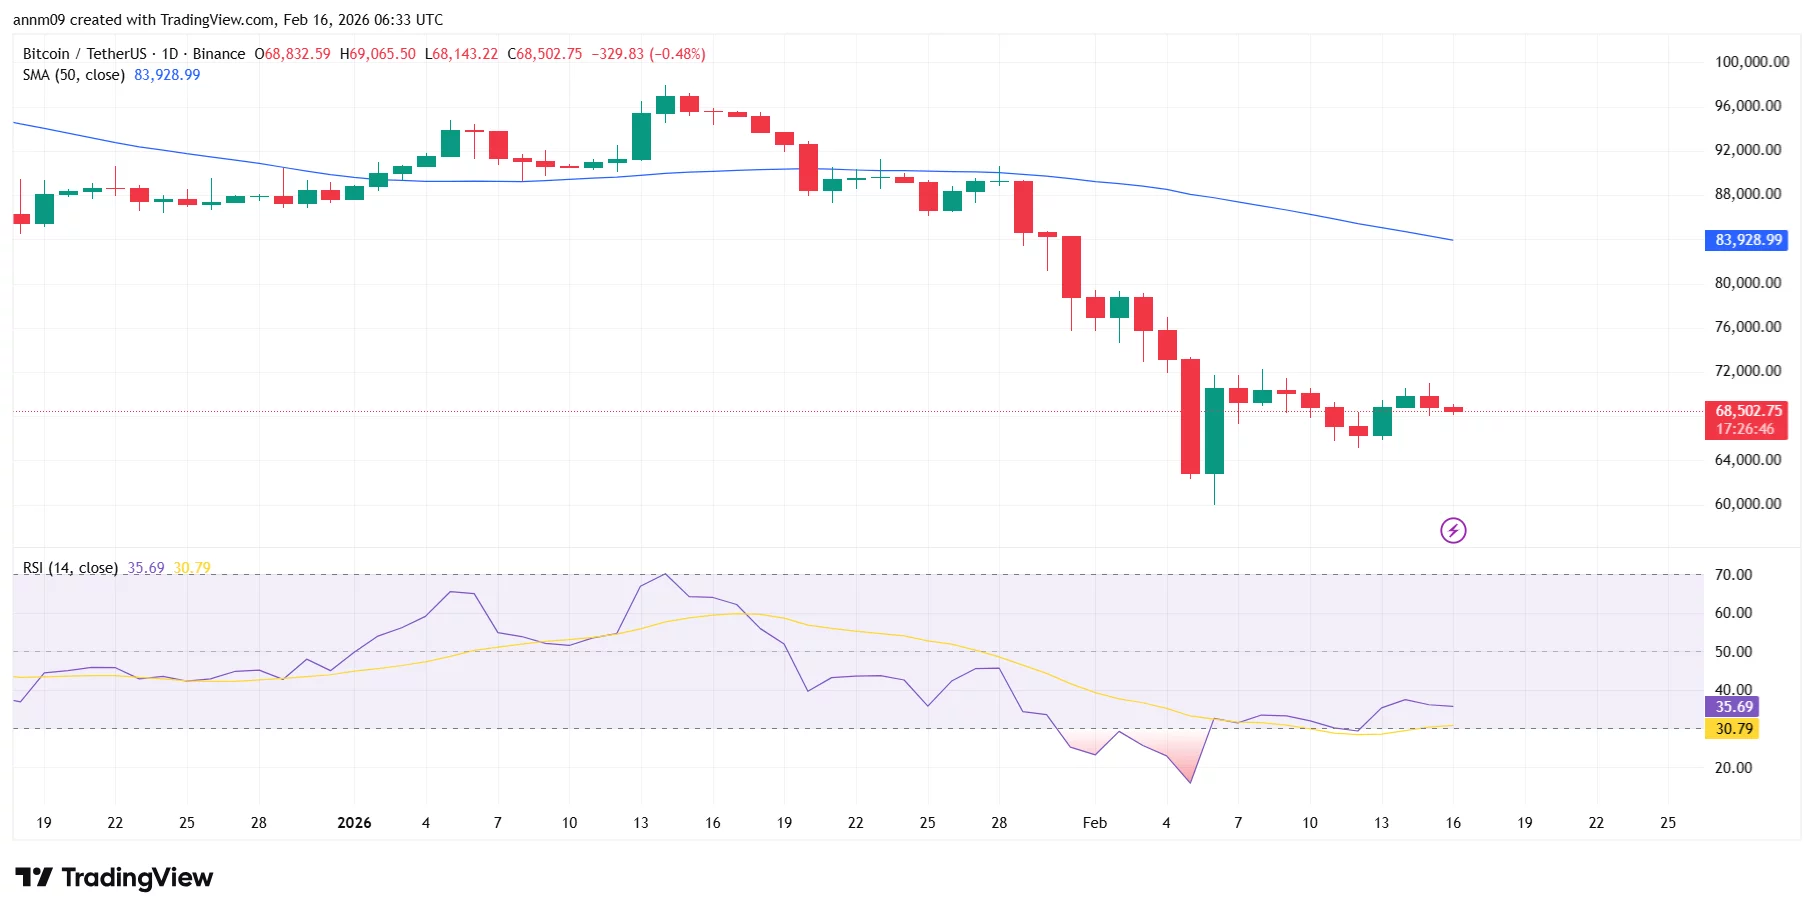
Price has formed a series of lower highs since topping near the mid-$90,000 range in January.

The Relative Strength Index (RSI) sits around 35, recovering from deeply oversold levels near 20 earlier this month. That rebound suggests selling momentum has cooled, but it does not yet confirm a trend reversal.

Immediate support is near $65,000, with stronger support in the $60,000–$62,000 zone, where a sharp capitulation wick formed earlier in February. Resistance stands near $72,000, followed by a heavier supply zone between $76,000 and $80,000.

A break below $65,000 could reopen downside risk toward $60,000. A decisive move above $72,000 would be the first sign that bulls are regaining control, regardless of seasonal narratives.

Market Opportunity
Bitcoin Logo
Bitcoin Price(BTC)
$66.003,92
$66.003,92$66.003,92
-2,49%
USD
Bitcoin (BTC) Live Price Chart
Disclaimer: The articles reposted on this site are sourced from public platforms and are provided for informational purposes only. They do not necessarily reflect the views of MEXC. All rights remain with the original authors. If you believe any content infringes on third-party rights, please contact service@support.mexc.com for removal. MEXC makes no guarantees regarding the accuracy, completeness, or timeliness of the content and is not responsible for any actions taken based on the information provided. The content does not constitute financial, legal, or other professional advice, nor should it be considered a recommendation or endorsement by MEXC.

You May Also Like

Wormhole’s W token enters ‘value accrual’ phase with strategic reserve

Wormhole’s W token enters ‘value accrual’ phase with strategic reserve

Wormhole has moved beyond its distribution phase, initiating a new strategy. By allocating on-chain and off-chain protocol revenue to a dedicated treasury, the cross-chain protocol is creating a direct link between its commercial success and the value of its native…
Share
Crypto.news2025/09/18 03:05
Wall Street sets AMD stock price target for next 12 months

Wall Street sets AMD stock price target for next 12 months

The post Wall Street sets AMD stock price target for next 12 months appeared on BitcoinEthereumNews.com. Advanced Micro Devices (NASDAQ: AMD) has been hit hard
Share
BitcoinEthereumNews2026/02/19 19:51
SUI Price Eyes Breakout, Targets $11 Says Analyst

SUI Price Eyes Breakout, Targets $11 Says Analyst

The post SUI Price Eyes Breakout, Targets $11 Says Analyst appeared on BitcoinEthereumNews.com. SUI price shows a technical setup for a macro breakout with analyst Dan Gambardello targeting $10-$11 levels. Recent partnership with Google’s Agentic Payments Protocol adds fundamental support to the technical analysis as SUI moves closer to potential breakout levels. SUI Price Analysis Points to $10-$11 Breakout Target Dan Gambardello has identified a clear ascending triangle formation on SUI price daily chart with upside targets around $10.79. The analyst simplified this target range to $10-$11 for practical trading purposes. The pattern shows sustained higher lows meeting resistance at current levels before a potential breakout. VanEck maintains more aggressive SUI crypto targets ranging from $13-$25 according to Gambardello’s research. SUI Price Analysis | Source: Dan Gambardello, X The $10 level is a more conservative higher high area for the current cycle. Midterm targets point to $7.50 in the 1.618 Fibonacci extension zone before longer-term objectives. The monthly RSI shows extreme compression that Gambardello describes as “screaming for a macro breakout to the upside.” This momentum oscillator behavior typically precedes major price movements in the crypto market. SUI crypto risk model currently sits at 51 and matches pre-bull market levels seen in coins like Ethereum. Gambardello compared this to Ethereum’s December 2020 reading of 51 before its major breakout. The March 2017 Ethereum reading of 53 preceded that cycle’s parabolic move. The analyst also noted that SUI price trades near the same levels from almost a year ago in November 2024. Bollinger Bands Signal Historic Compression CryptoBullet has identified the tightest Bollinger Bands in SUI’s entire trading history on the weekly chart. The BBW indicator compression reached levels that were historically followed by major price movements. This setup mirrors conditions before SUI’s previous major rallies. Historical data shows SUI price delivered +253% gains between December 2023 and March 2024 following similar compression. SUI…
Share
BitcoinEthereumNews2025/09/18 11:32