Ethereum faces bearish pressure, holding key support levels near $1,900. Can Ethereum reclaim $3,347 to reverse current downward trend? Spot flows and derivativesEthereum faces bearish pressure, holding key support levels near $1,900. Can Ethereum reclaim $3,347 to reverse current downward trend? Spot flows and derivatives

Ethereum Price Prediction 2026–2030: Can ETH Break Above $3,347 Soon?

2026/02/15 00:16
6 min read
  • Ethereum faces bearish pressure, holding key support levels near $1,900.
  • Can Ethereum reclaim $3,347 to reverse current downward trend?
  • Spot flows and derivatives show market indecision, waiting for direction.

Ethereum continues to trade under heavy pressure, holding below key resistance levels while facing substantial downside risks. With a critical support level at $1,960, Ethereum must defend this zone to avoid further downside pressure. Despite the bearish trend, traders are eyeing potential breakouts that could shift the trend.


Ethereum’s price today trades near $2,345, showing slight movement in the past 24 hours. This comes after a major rejection near the $3,347 level, where ETH failed to break above resistance. With a clear bearish structure in place, the key question remains: Can Ethereum reclaim $3,347, or will the downward momentum continue?


Also Read: ASTR (ASTER) Price Prediction 2026–2030: Can ASTER Hit $1.00 Soon?


Spot Inflows and Derivatives Data Signal Caution Among Traders

Exchange flow data and derivatives activity indicate cautious sentiment among traders, with Ethereum’s open interest decreasing steadily. According to Coinglass, Ethereum’s open interest has recently dropped to $23 billion, signaling a retreat from leveraged positions. Additionally, mixed spot flows show both inflows and outflows, as investors balance risk reduction against accumulation, signaling indecision in the market.
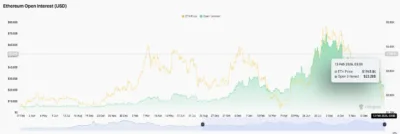

ethereum

Source: Coinglass

The recent price weakness has led to deleveraging, while spot flows show fluctuations between inflows, profit-taking, and neutral activity, revealing uncertainty about Ethereum’s next move. The market appears to be waiting for clearer direction before making any major moves, as traders are reluctant to take aggressive positions under current market conditions.


Key Levels and Technical Outlook for Ethereum

Ethereum’s price structure is clearly defined, with both resistance and support levels playing key roles in its price action. The most immediate resistance levels are between $2,234 and $2,512, where sellers are likely to defend. A breakout above this range could lead Ethereum toward $2,968, a key mid-range ceiling. However, if Ethereum fails to reclaim these levels, it may face further downside risk, potentially reaching $1,740, a major structural support on the daily chart. Below $1,740, ETH could experience a significant drop toward the $1,600 to $1,500 demand area.
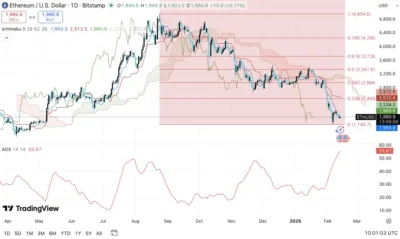

ethereum

Source: Tradingview

The Ichimoku cloud overhead continues to reinforce resistance and limit bullish attempts, signaling that buyers must reclaim the $3,347 level to shift the trend in their favor. Until that happens, the bearish outlook remains intact, with momentum indicators supporting the view that sellers maintain control.


Ethereum’s Range-Bound Trading Shows Strong Bearish Trend

Ethereum has been trading within a range, facing resistance at $2,234 and support at $1,960. The Relative Strength Index (RSI) remains neutral at 45.21, showing a lack of strong directional bias. Buyers have attempted to defend the $1,960–$1,900 support zone, but sellers continue to control the market, pushing ETH lower. As the price consolidates between these ranges, Ethereum’s near-term direction hinges on whether the bulls can break above $2,234–$2,512.


A move above these levels could signal the start of a recovery phase, but failure to hold support could result in a deeper decline. The market is currently in a decisive zone, and the next leg will depend on whether buyers step in with conviction or allow the broader downtrend to continue.


Key Support and Resistance Levels for Ethereum

For Ethereum’s bullish thesis to remain intact, it must first defend the $1,960–$1,900 support band. A breakdown below this area could push the price lower toward the $1,740 structural floor. On the upside, Ethereum needs to break through the $2,234–$2,512 resistance range, which has proved challenging for buyers. If Ethereum manages to break this resistance zone, it could open the path toward the $2,968 mid-range ceiling.


The most crucial resistance level is $3,347, which would signal a broader trend reversal if successfully reclaimed. For now, Ethereum remains firmly within a bearish channel, with momentum indicators suggesting that sellers retain the upper hand.


Ethereum Price Prediction 2026–2030

YearMinimum PriceAverage PriceMaximum Price
2026$1,500$2,500$3,000
2027$1,700$2,700$3,200
2028$1,800$3,000$3,500
2029$2,000$3,200$4,000
2030$2,300$3,500$4,500

2026
Ethereum enters 2026 with significant bearish pressure but continues to find support around the $1,900 region. The next key resistance is $2,234–$2,512. A confirmed breakout above this level could pave the way for a price surge, but until then, Ethereum could remain within a consolidation phase, holding between support and resistance zones.


2027
If the market shifts toward recovery in 2027, Ethereum could push past $2,512, reclaiming higher levels as institutional interest and network adoption rise. A move toward $3,000 remains a possibility if bullish momentum strengthens.


2028
Ethereum’s price could see further upside potential if its underlying technology gains more mainstream adoption. By 2028, ETH might approach the $3,500 mark, supported by growing demand and institutional investment in decentralized finance (DeFi) applications and smart contract use cases.


2029
Ethereum’s price trajectory could test new highs by 2029. Assuming it successfully holds above critical support levels, ETH could aim for $4,000, with increasing adoption and technological advancements further boosting its price.


2030
Looking further ahead, Ethereum’s long-term growth could solidify above the $3,500 level. If Ethereum continues its network upgrades and captures greater market share in blockchain technology, it could challenge the $4,500 range.


Conclusion

Ethereum’s market outlook remains bearish in the short term, with critical resistance levels preventing upside movement. However, Ethereum’s potential for growth remains intact, especially if the bulls can reclaim key resistance zones such as $2,234–$2,512. The outlook for 2026–2030 is cautiously optimistic, with Ethereum positioned for long-term growth if it can break out of its current bearish trend.


FAQs

1.Why is Ethereum’s price moving sideways now?
Ethereum is in a consolidation phase, with support at $1,900 and resistance around $2,234–$2,512. The market is waiting for a breakout to determine the next major direction.


2.What is the key support level for Ethereum?
The key support level is between $1,960 and $1,900, which must hold to prevent further downside.


3.What resistance must Ethereum break to turn bullish?
Ethereum must break above the $2,234–$2,512 range to signal a potential trend reversal and pave the way for higher prices.


4. Could Ethereum fall back to $1,500?
Yes, if Ethereum breaks below its critical support level around $1,900, it could head toward the $1,740–$1,500 demand area.


5.Is Ethereum still in a downtrend?
Yes, Ethereum is currently in a downtrend, but there are opportunities for recovery if it breaks through key resistance levels.


Also Read: Bitcoin Price Prediction 2026–2030: Can BTC Break Above $100,000 Soon?


The post Ethereum Price Prediction 2026–2030: Can ETH Break Above $3,347 Soon? appeared first on 36Crypto.

Market Opportunity
Ucan fix life in1day Logo
Ucan fix life in1day Price(1)
$0.0005595
$0.0005595$0.0005595
-6.07%
USD
Ucan fix life in1day (1) Live Price Chart
Disclaimer: The articles reposted on this site are sourced from public platforms and are provided for informational purposes only. They do not necessarily reflect the views of MEXC. All rights remain with the original authors. If you believe any content infringes on third-party rights, please contact service@support.mexc.com for removal. MEXC makes no guarantees regarding the accuracy, completeness, or timeliness of the content and is not responsible for any actions taken based on the information provided. The content does not constitute financial, legal, or other professional advice, nor should it be considered a recommendation or endorsement by MEXC.

You May Also Like

Will SEC Approve T. Rowe’s XRP-Inclusive Crypto ETF?

Will SEC Approve T. Rowe’s XRP-Inclusive Crypto ETF?

SEC to decide by Feb. 26, 2026 on NYSE Arca’s proposal to list T. Rowe Price’s Active Crypto ETF, which includes XRP exposure. The U.S. Securities and Exchange
Share
LiveBitcoinNews2026/02/19 13:00
What Are Crypto Narratives? Top 9 Narratives for 2026

What Are Crypto Narratives? Top 9 Narratives for 2026

Cryptsy - Latest Cryptocurrency News and Predictions Cryptsy - Latest Cryptocurrency News and Predictions - Experts in Crypto Casinos The world of cryptocurrency
Share
Cryptsy2026/02/19 13:09
August Crypto Market Review: ETH Leads the Rise, Institutional Funding and Macro Factors Dominate Market Trends

August Crypto Market Review: ETH Leads the Rise, Institutional Funding and Macro Factors Dominate Market Trends

By Jianing Wu , Galaxy Digital Compiled by Tim, PANews August saw various crossover signals between the macro economy and the crypto market. In traditional markets, investors faced conflicting inflation signals: the CPI released at the beginning of the month came in below expectations, but the subsequent Producer Price Index (PPI) came in above expectations. This was coupled with weakening employment data and growing market expectations that the Federal Reserve would begin cutting interest rates in September. At the end of the month's Fed meeting in Jackson Hole, Wyoming, Chairman Powell struck a dovish tone, emphasizing the "shifting balance of risks" brought about by rising unemployment, which reinforced expectations of a shift toward easing monetary policy. The stock market closed higher in a volatile session, with the S&P 500 fluctuating with the data releases. Defensive assets like gold outperformed at the end of the month. The crypto market reflected this macro uncertainty, with increased volatility. Bitcoin hit an all-time high of over $124,000 in mid-August before retreating to around $110,000, while Ethereum's gains for the entire month outpaced Bitcoin's. After experiencing its largest single-day outflow at the beginning of the month, Ethereum ETFs quickly attracted strong inflows, briefly surpassing Bitcoin's despite Ethereum's smaller market capitalization. However, the recovery in demand pushed ETH prices to a new high near $4,953, and the ETH/BTC exchange rate rose to 0.04 for the first time since November 2024. The fluctuations in ETF trading highlight that institutional position adjustments are increasingly influencing price trends, and ETH is clearly the leader in this cycle. In terms of laws and policies, regulators are gradually pushing forward reforms to reshape the industry landscape. The U.S. Department of Labor has opened the door to allocating crypto assets to 401(k) pension plans, while the U.S. SEC has explicitly stated that certain liquidity pledge businesses do not fall under the category of securities. Application trends at the market structure and institutional levels are deepening. Treasury Secretary Bessant disclosed for the first time that strategic Bitcoin reserves now hold between 120,000 and 170,000 coins, revealing the government's cumulative cryptocurrency holdings for the first time. Business activity is also accelerating: Stablecoin issuers Stripe and Circle announced plans to develop independent L1 blockchains, while Wyoming became the first state government in the US to issue a dollar-denominated stablecoin. Google also joined the enterprise blockchain fray with its "Universal Ledger" system. Meanwhile, crypto treasury companies continue to increase their asset allocation efforts. Overall, August reinforced two key trends. On the one hand, macro volatility and policy uncertainty triggered significant market volatility in both the equity and crypto markets; on the other, the underlying trend of market institutionalization is accelerating, from ETF flows to widespread adoption by sovereign institutions and corporations. These intertwining forces are likely to continue to dominate market movements as the autumn approaches, with the Federal Reserve's policy shift and ongoing structural demand likely setting the tone for the next phase of the cycle. 1. Spikes, Breakouts, and Reversals In the first half of August, Ethereum led the market, outperforming Bitcoin and driving a broad rally in altcoins. The Bloomberg Galaxy Crypto Index shows that Bitcoin hit an all-time high of $124,496 on August 13 before reversing course, closing the month at $109,127, down from $116,491 at the beginning of the month. A week later, on August 22, Ethereum broke through the previous cycle high, reaching $4,953, surpassing the November 2021 high of $4,866 and ending a four-year consolidation. Ethereum's strong performance is particularly noteworthy given its underperformance for much of this cycle. Since its April low near $1,400, the price of Ether has more than tripled, driven by strong ETF flows and purchases by crypto treasury firms. U.S. spot Ethereum ETFs saw net inflows of approximately $4 billion in August, the second-strongest month after July. In contrast, U.S. spot Bitcoin ETFs saw net outflows of approximately $639 million. However, despite a price decline in the last two weeks of August, Bitcoin ETF inflows turned positive. As market expectations for aggressive interest rate cuts from the Federal Reserve grew, Bitcoin's store-of-value narrative regained focus. As the likelihood of a rate cut increased, Bitcoin's correlation with gold strengthened significantly that month. Besides ETFs, crypto treasury firms remain a significant source of demand. These firms continued to increase their holdings throughout August, with Ethereum-focused treasuries in particular injecting significant capital. Because Ethereum's market capitalization is smaller than Bitcoin's, corporate capital inflows have a disproportionate impact on spot prices. A $1 billion allocation to Ethereum can significantly impact the market landscape, far more than a similar amount allocated to Bitcoin. Furthermore, significant funds remain undeployed among publicly disclosed crypto treasury firms, suggesting further positive market conditions. The total cryptocurrency market capitalization climbed to a record high of $4.2 trillion that month, demonstrating the deep correlation between crypto assets and broader market trends. Rising expectations of interest rate cuts boosted risk appetite in both the stock and crypto markets, while ETF inflows and corporate reserve accumulation directly contributed to record highs for BTC and ETH. Despite market volatility near the end of the month, the interplay of loose macro policies, institutional capital flows, and crypto treasury reserve needs has maintained the crypto market's central position in the risk asset narrative. 2. Each company launches its own L1 public chain Favorable regulations are giving businesses more confidence to enter the crypto market directly. In late July, US SEC Chairman Paul Atkins announced the launch of "Project Crypto," an initiative aimed at promoting the on-chain issuance and trading of stocks, bonds, and other financial instruments. This initiative marks a key step in the integration of traditional market infrastructure with blockchain technology. Encouraged by this, businesses are breaking through the limitations of existing blockchain applications and launching their own Layer 1 networks. In August, three major companies announced the launch of new L1 blockchains. Circle launched Arc, which is compatible with the EVM and uses its USDC stablecoin as its native gas token. Arc features compliance and privacy features, a built-in on-chain foreign exchange settlement engine, and will launch with a permissioned validator set. Following its acquisitions of stablecoin infrastructure provider Bridge and crypto wallet service provider Privy, Stripe launched Tempo Chain, also compatible with the EVM and focused on stablecoin payments and enterprise applications. Google released the Google Cloud Universal Ledger (GCUL), a private permissioned blockchain focused on payments and asset issuance. It supports Python-based smart contracts and has attracted CME Group as a pilot partner. The logic behind enterprise blockchain development boils down to value capture, control, and independent design. By owning the underlying protocol, companies like Circle avoid paying network fees to third parties and profit directly from transaction activity. Stripe, on the other hand, can more tightly integrate its proprietary blockchain with payment systems, developing new features for customers without relying on the governance mechanisms of other chains. Both companies view control as a key element of compliant operations, particularly as regulators increase their scrutiny of illicit financial activities. Choosing to build on L1 rather than L2 avoids being constrained by other blockchain networks in terms of settlement or consensus mechanisms. Reactions from the crypto-native community have been mixed. Many believe that projects like Arc and GCUL, while borrowing technical standards from existing L1 chains, are inferior in design and exclude Ethereum and other native assets. Critics point out that permissioned validators and corporate-led governance models undermine decentralization and user autonomy. These debates echo the failed wave of "enterprise blockchains" in the mid-2010s, which ultimately failed to attract real users. Despite skepticism, these companies' moves are significant. Stripe processes over $1 trillion in payments annually, holding approximately 17% of the global payment processing market. If Tempo can achieve lower costs or offer better developer tools, competitors may be forced to follow suit. Google's entry demonstrates that major tech companies view blockchain as the next evolutionary level of financial infrastructure. If these companies can bring their scale, distribution capabilities, and regulatory resources to this area, the impact could be profound. In addition to businesses launching their own Layer 1 chains, other developments reinforce the trend of economic activity migrating on-chain. U.S. Secretary of Commerce Lutnick announced that GDP data will be published on public blockchains via oracle networks such as Chainlink and Python. Galaxy tokenized its shares to test on-chain secondary market trading. These initiatives demonstrate that businesses and governments are beginning to embed blockchain technology into core financial and data infrastructure, despite ongoing debate over the appropriate balance between compliance and decentralization. 3. Hot Trend: Crypto Treasury Companies The crypto treasury trends we highlighted in our earlier report continue. Bitcoin, Ethereum, and Solver (SOL) holdings continue to accumulate, with Ethereum showing the strongest performance. Holdings data shows a sharp rise in ETH's crypto treasury throughout August, primarily driven by Bitmine's reserves, which increased from approximately 625,000 ETH at the beginning of August to over 2 million currently. Solver holdings also maintained steady growth, while BTC holdings continued their slower but steady accumulation. Compared to ETF fund flows, the activity of crypto treasury companies appears relatively flat. In July and August, ETF fund inflows were stronger than those of crypto treasury companies, and the cumulative balance of ETFs also exceeded the cumulative size of crypto treasury companies. This divergence is becoming increasingly apparent as premiums on crypto treasury stocks shrink across the board. Earlier this summer, price-to-earnings ratios for crypto treasury companies were significantly higher than their net asset values, but these premiums have gradually returned to more normal levels, signaling a growing caution among stock market investors. The stock price fluctuations are evident: KindlyMD (Nakamoto's parent company) has fallen from a peak of nearly $25 in late May to around $5, while Bitmine has fallen from $62 in early August to around $46. Selling pressure intensified in late August amid reports that Nasdaq may tighten its oversight of acquisitions of crypto treasury companies through stock offerings. This news accelerated the sell-off in shares of Ethereum-focused crypto treasury companies. Bitcoin-focused companies, such as Strategy (formerly MicroStrategy, ticker symbol: MSTR), were less affected because their acquisition strategies rely more on debt financing than equity issuance. 4. Hot Trend: Copycat Season Another hot trend is the rotation into altcoins. Bitcoin's dominance has gradually declined, from approximately 60% at the beginning of August to 56.5% by the end of the month, while Ethereum's market share has risen from 11.7% to 13.6%. Data indicates a rotation out of Bitcoin into Ethereum and other cryptocurrencies, which aligns with the outperformance of Ethereum ETFs and inflows into crypto treasury firms. While Bitcoin ETF inflows have rebounded in recent weeks, the overall trend remains unchanged: this cycle continues to expand beyond Bitcoin, with Ethereum and altcoins gaining incremental market share. 5. Our views and predictions As markets head into the final weeks of September, all eyes are on the Federal Reserve. Labor market weakness is solidifying expectations of a near-term rate cut and reinforcing risk assets. The jobs report underscores that the economic slowdown may be deeper than initially reported, raising questions about how much easing policy will be needed to cushion the economy. Meanwhile, the long end of the yield curve is flashing warning signs. Persistently high 10-year and 30-year Treasury yields reflect market concerns that inflation may be sticky and that fiscal pressures may ultimately force central banks to finance debt and spending through money printing. Expectations of short-term interest rate cuts are driving a rebound in risky assets, but the tug-of-war between short-term support from rate cuts and long-term concerns pushing yields and precious metals higher will determine the sustainability of this rebound. This conflicting dynamic has a direct impact on cryptocurrencies: Bitcoin's correlation with gold as a store of value and hedge is growing, while Ethereum and altcoins remain more sensitive to shifts in overall risk appetite.
Share
PANews2025/09/18 17:40