

Crypto Today: Bitcoin, Ethereum, XRP halt decline ahead of Fed meeting minutes release
- Bitcoin resurfaces above $113,000 on Wednesday after a nearly 3% drop the previous day.
- Ethereum bounces after dropping under $4,100 to test the lower boundary of a rising channel.
- Ripple’s XRP breaks under a crucial support stronghold, with sellers targeting the $2.75 zone.
Bitcoin (BTC), Ethereum (ETH), and Ripple (XRP) recover on Wednesday after two consecutive days of losses ahead of the release of the Federal Reserve's (Fed) meeting minutes later today. Bitcoin resurfaces above the $113,000 level on Wednesday following the 2.89% drop from the previous day.
Ethereum bounces off by over 3% from a support trendline of a rising channel pattern, hinting at a potential reversal. However, Ripple’s XRP struggles to find solid ground, with bears targeting further losses to test the monthly low.
Anticipation rises ahead of Federal Reserve meeting minutes
The broader financial market anticipates a possible interest rate cut by the Fed in September. However, optimism has faded to a 25 basis point (bps) reduction after the July US Producer Price Index (PPI) data release last week, from the previous 50 bps interest rate cut chances induced by the US Consumer Price Index (CPI) data.
The Minutes of the Federal Reserve's last meeting are scheduled to become public on Wednesday at 18:00 GMT. All eyes are on the minutes release, which could clarify the Fed's stance on possible rate cut decisions in September.
CoinGlass data shows that the Open Interest (OI) of the crypto market decreased to $195.34 billion on Wednesday from $201.80 billion the previous day. A drop in OI indicates that capital is flowing out of the crypto market as traders adopt a wait-and-see strategy.
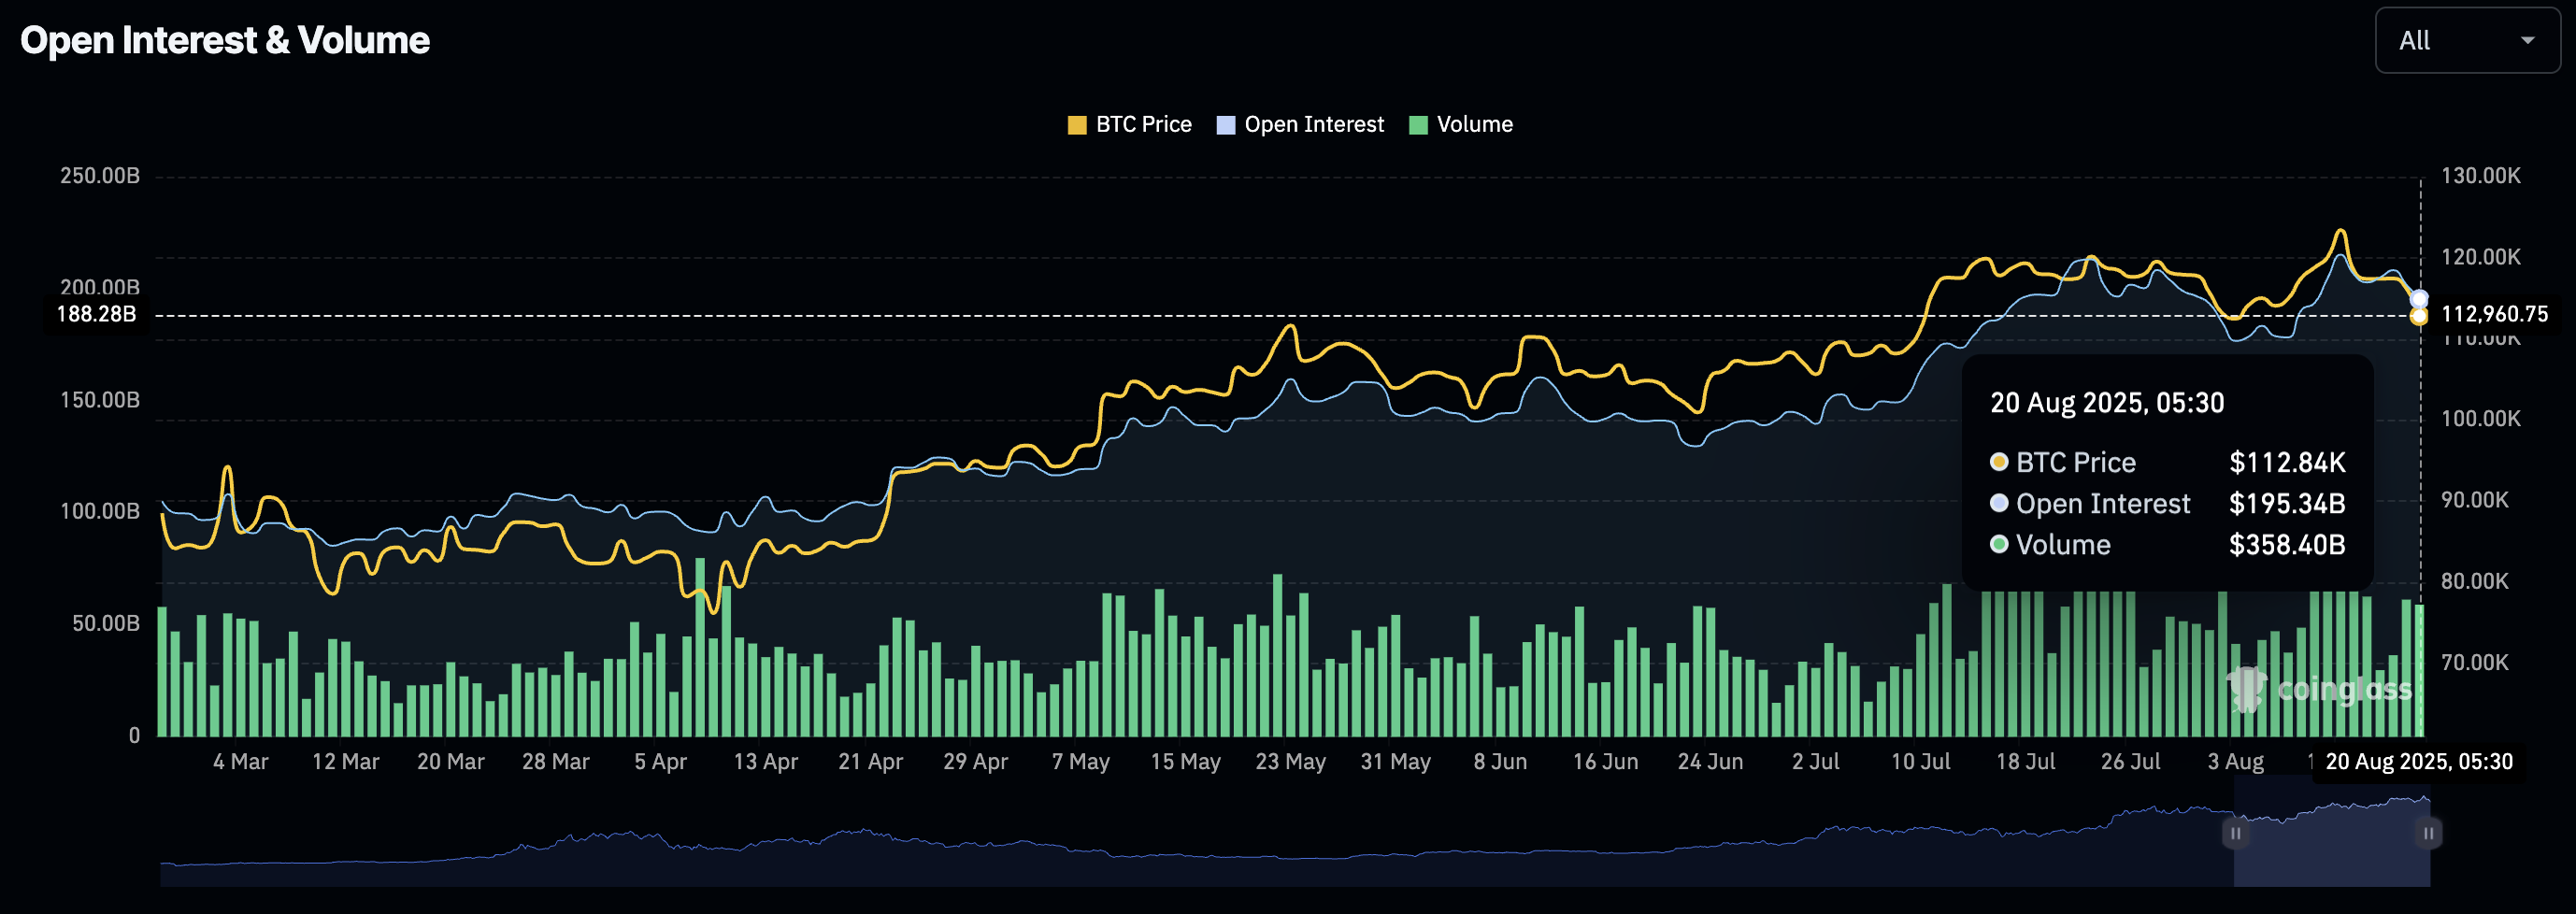
Crypto Open Interest. Source: Coinglass
Amidst this, the liquidations in the crypto market have reached $447.98 million in the last 24 hours, comprising $362.31 million in long liquidations, which outpace $85.67 million in short liquidations.
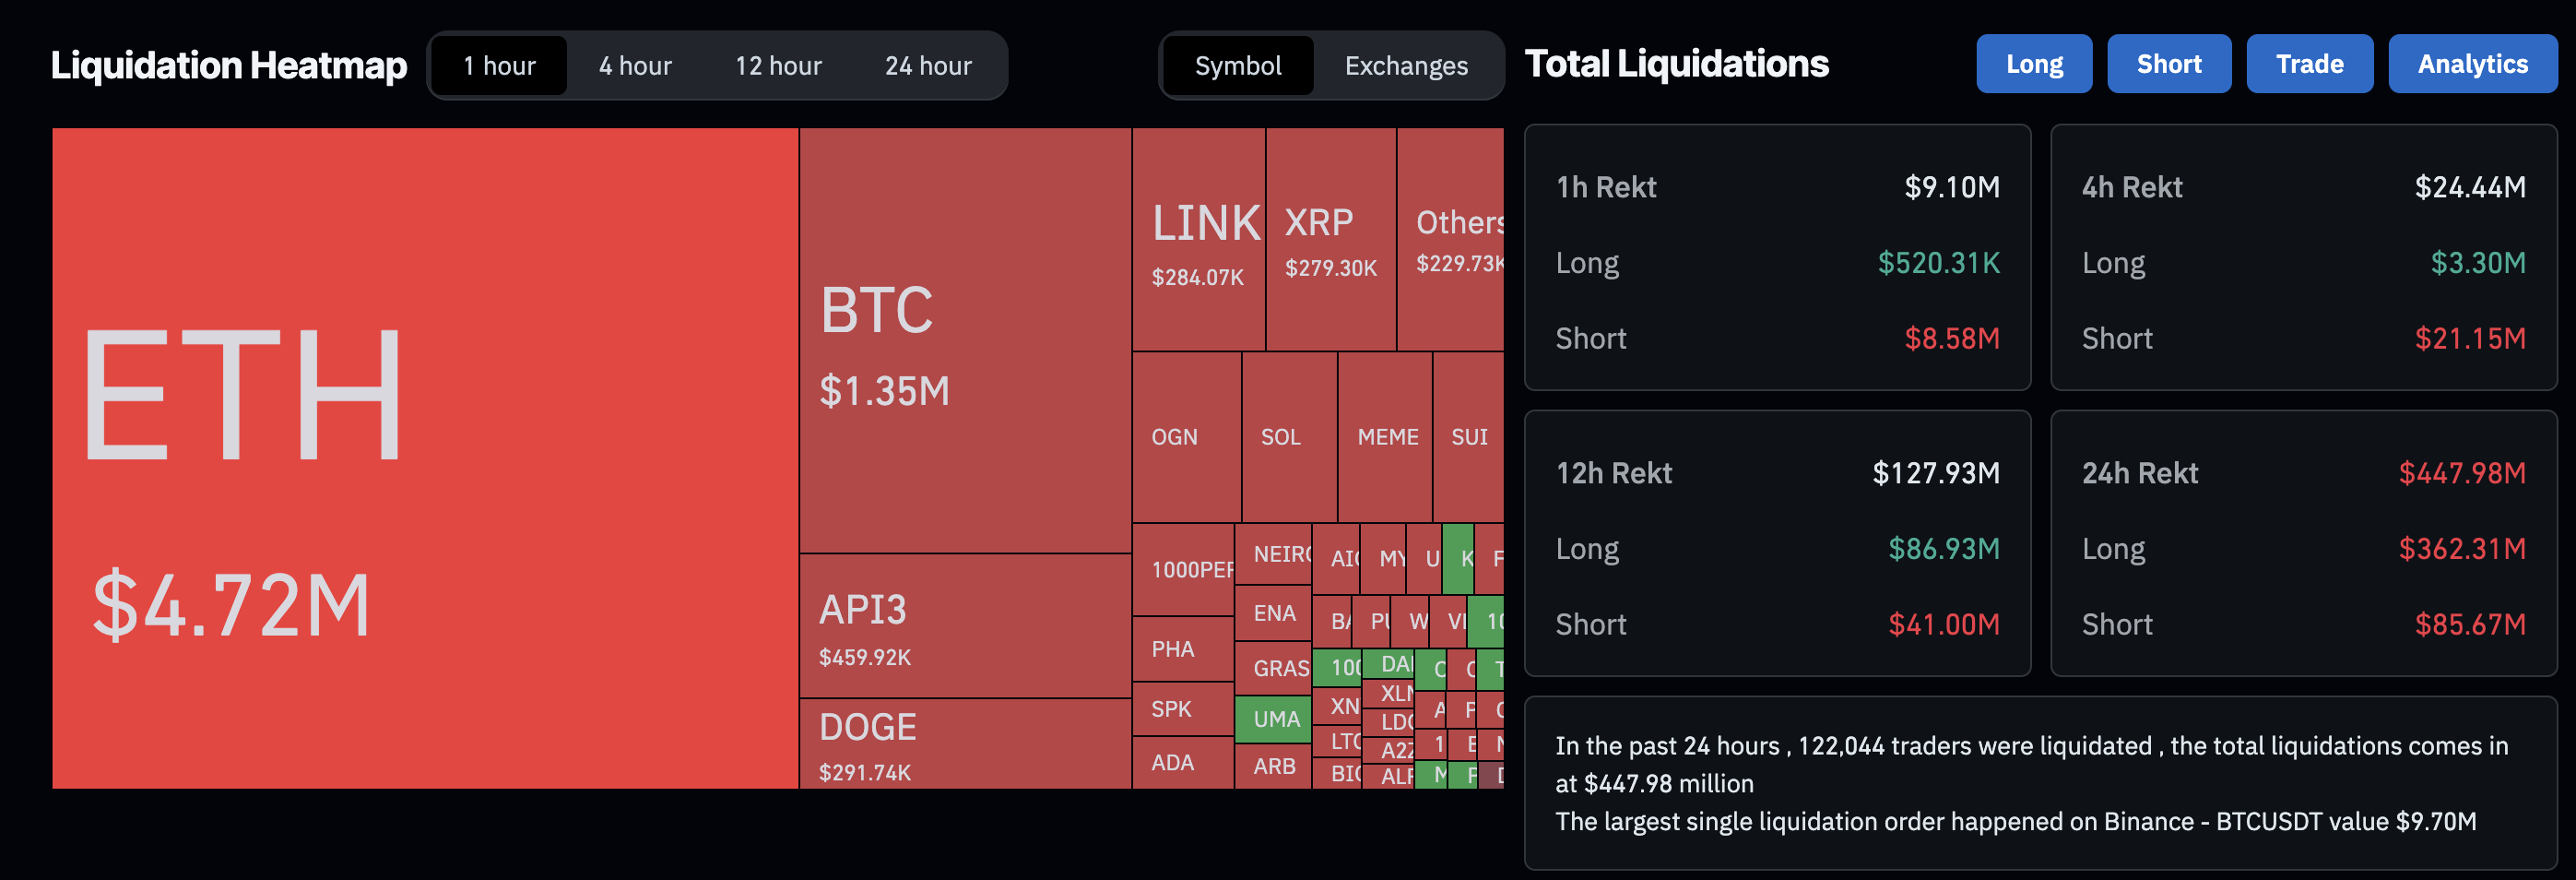
Liquidations data. Source: Coinglass
Bitcoin holds above a crucial support level
Bitcoin trades above $113,000 at the time of writing on Wednesday after reaching a low of $112,566 earlier in the day. The minor recovery adds up to nearly 1% with bulls eyeing above $114,000, after the 2.89% drop on Tuesday breached the 50-day Exponential Moving Average (EMA) at $114,911.
If the market remains optimistic with the release of Fed meeting minutes, Bitcoin’s recovery could test the 50-day EMA at $114,911.
The Moving Average Convergence Divergence (MACD) extends the declining trend after crossing below its signal line on Saturday, which flashed a sell signal. A successive trend of red histogram bars below the zero line reflects a surge in bearish momentum.
The Relative Strength Index (RSI) is currently at 42 on the daily chart, showing a sideways movement above the oversold zone, which suggests weakened buying pressure.
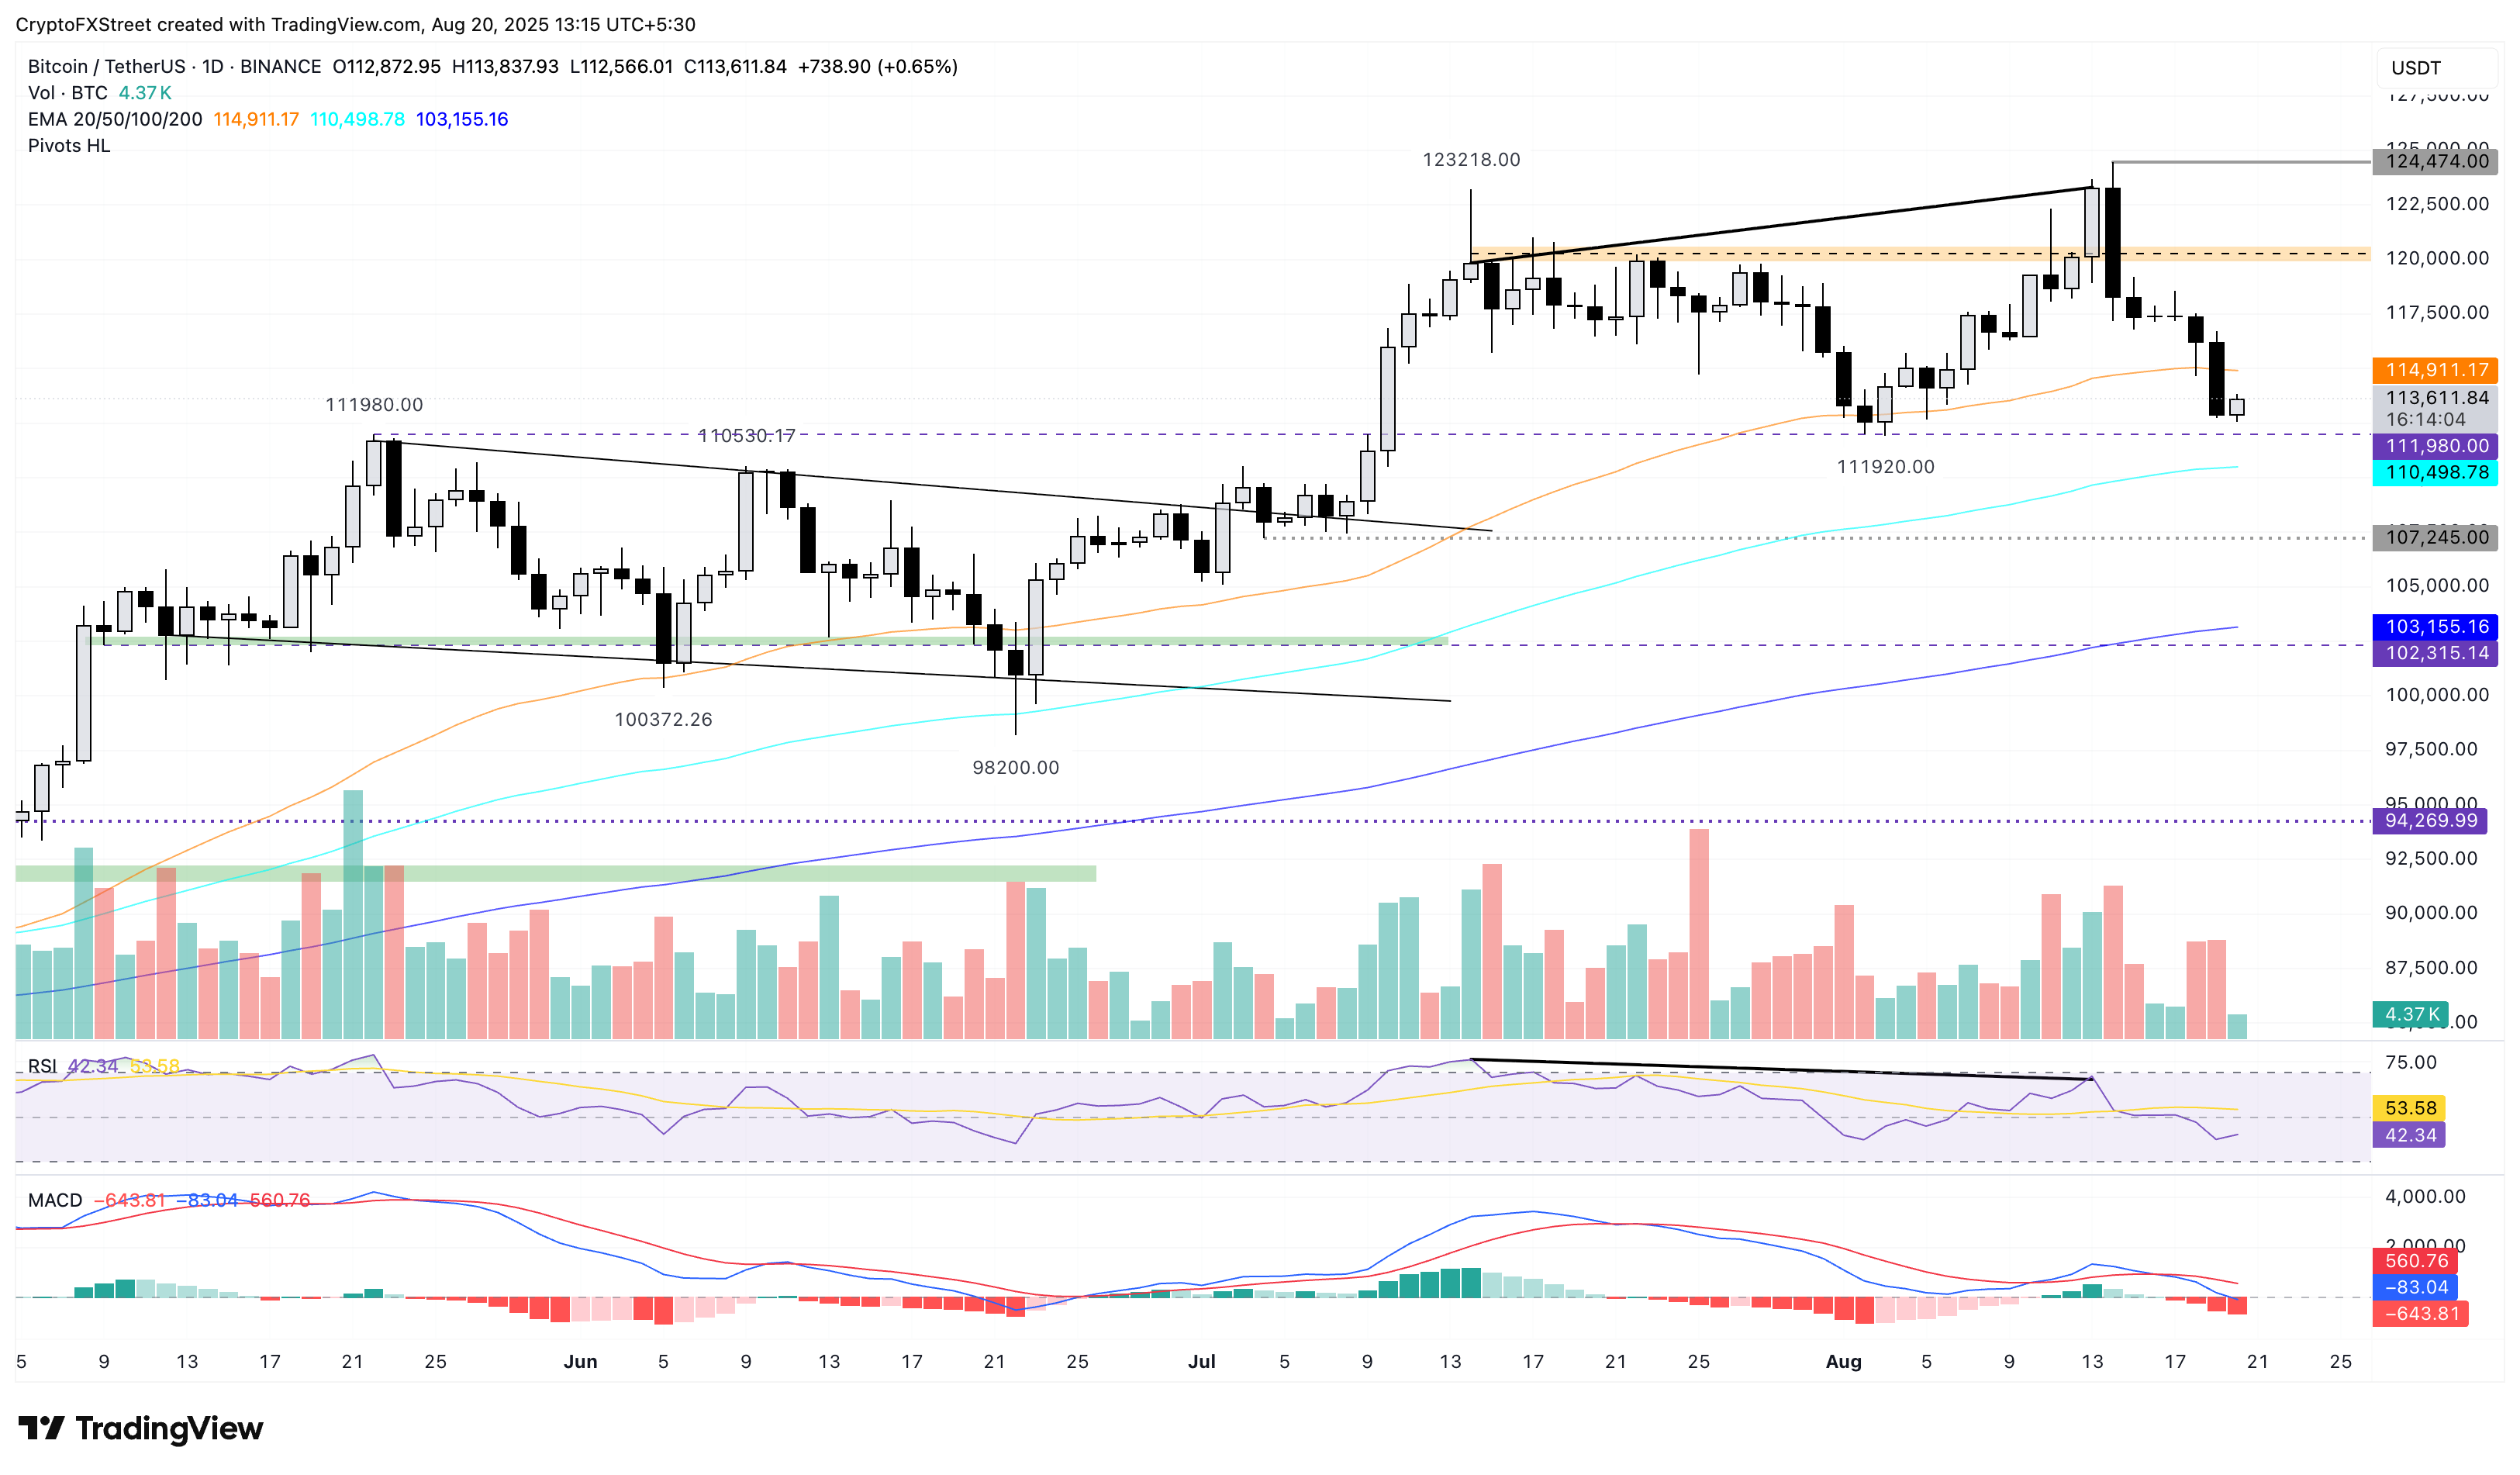
BTC/USDT daily price chart.
Looking down, a slip below the monthly low of $111,920 could extend the decline to the 100-day EMA at $110,498. The next level below this dynamic support lies at $107,245.
Ethereum’s recovery in a channel eyes further growth
Ethereum recovers by over 3% at press time on Wednesday, bouncing off the support trendline of a rising channel pattern on the daily chart (shared below). An extended recovery in ETH could test the all-time high of $4,868.
The momentum indicators flash mixed signals on the daily chart. The MACD and its signal line decline after flashing a sell signal on Sunday. Additionally, the RSI at 55 bounces off the midpoint, remaining at neutral levels.
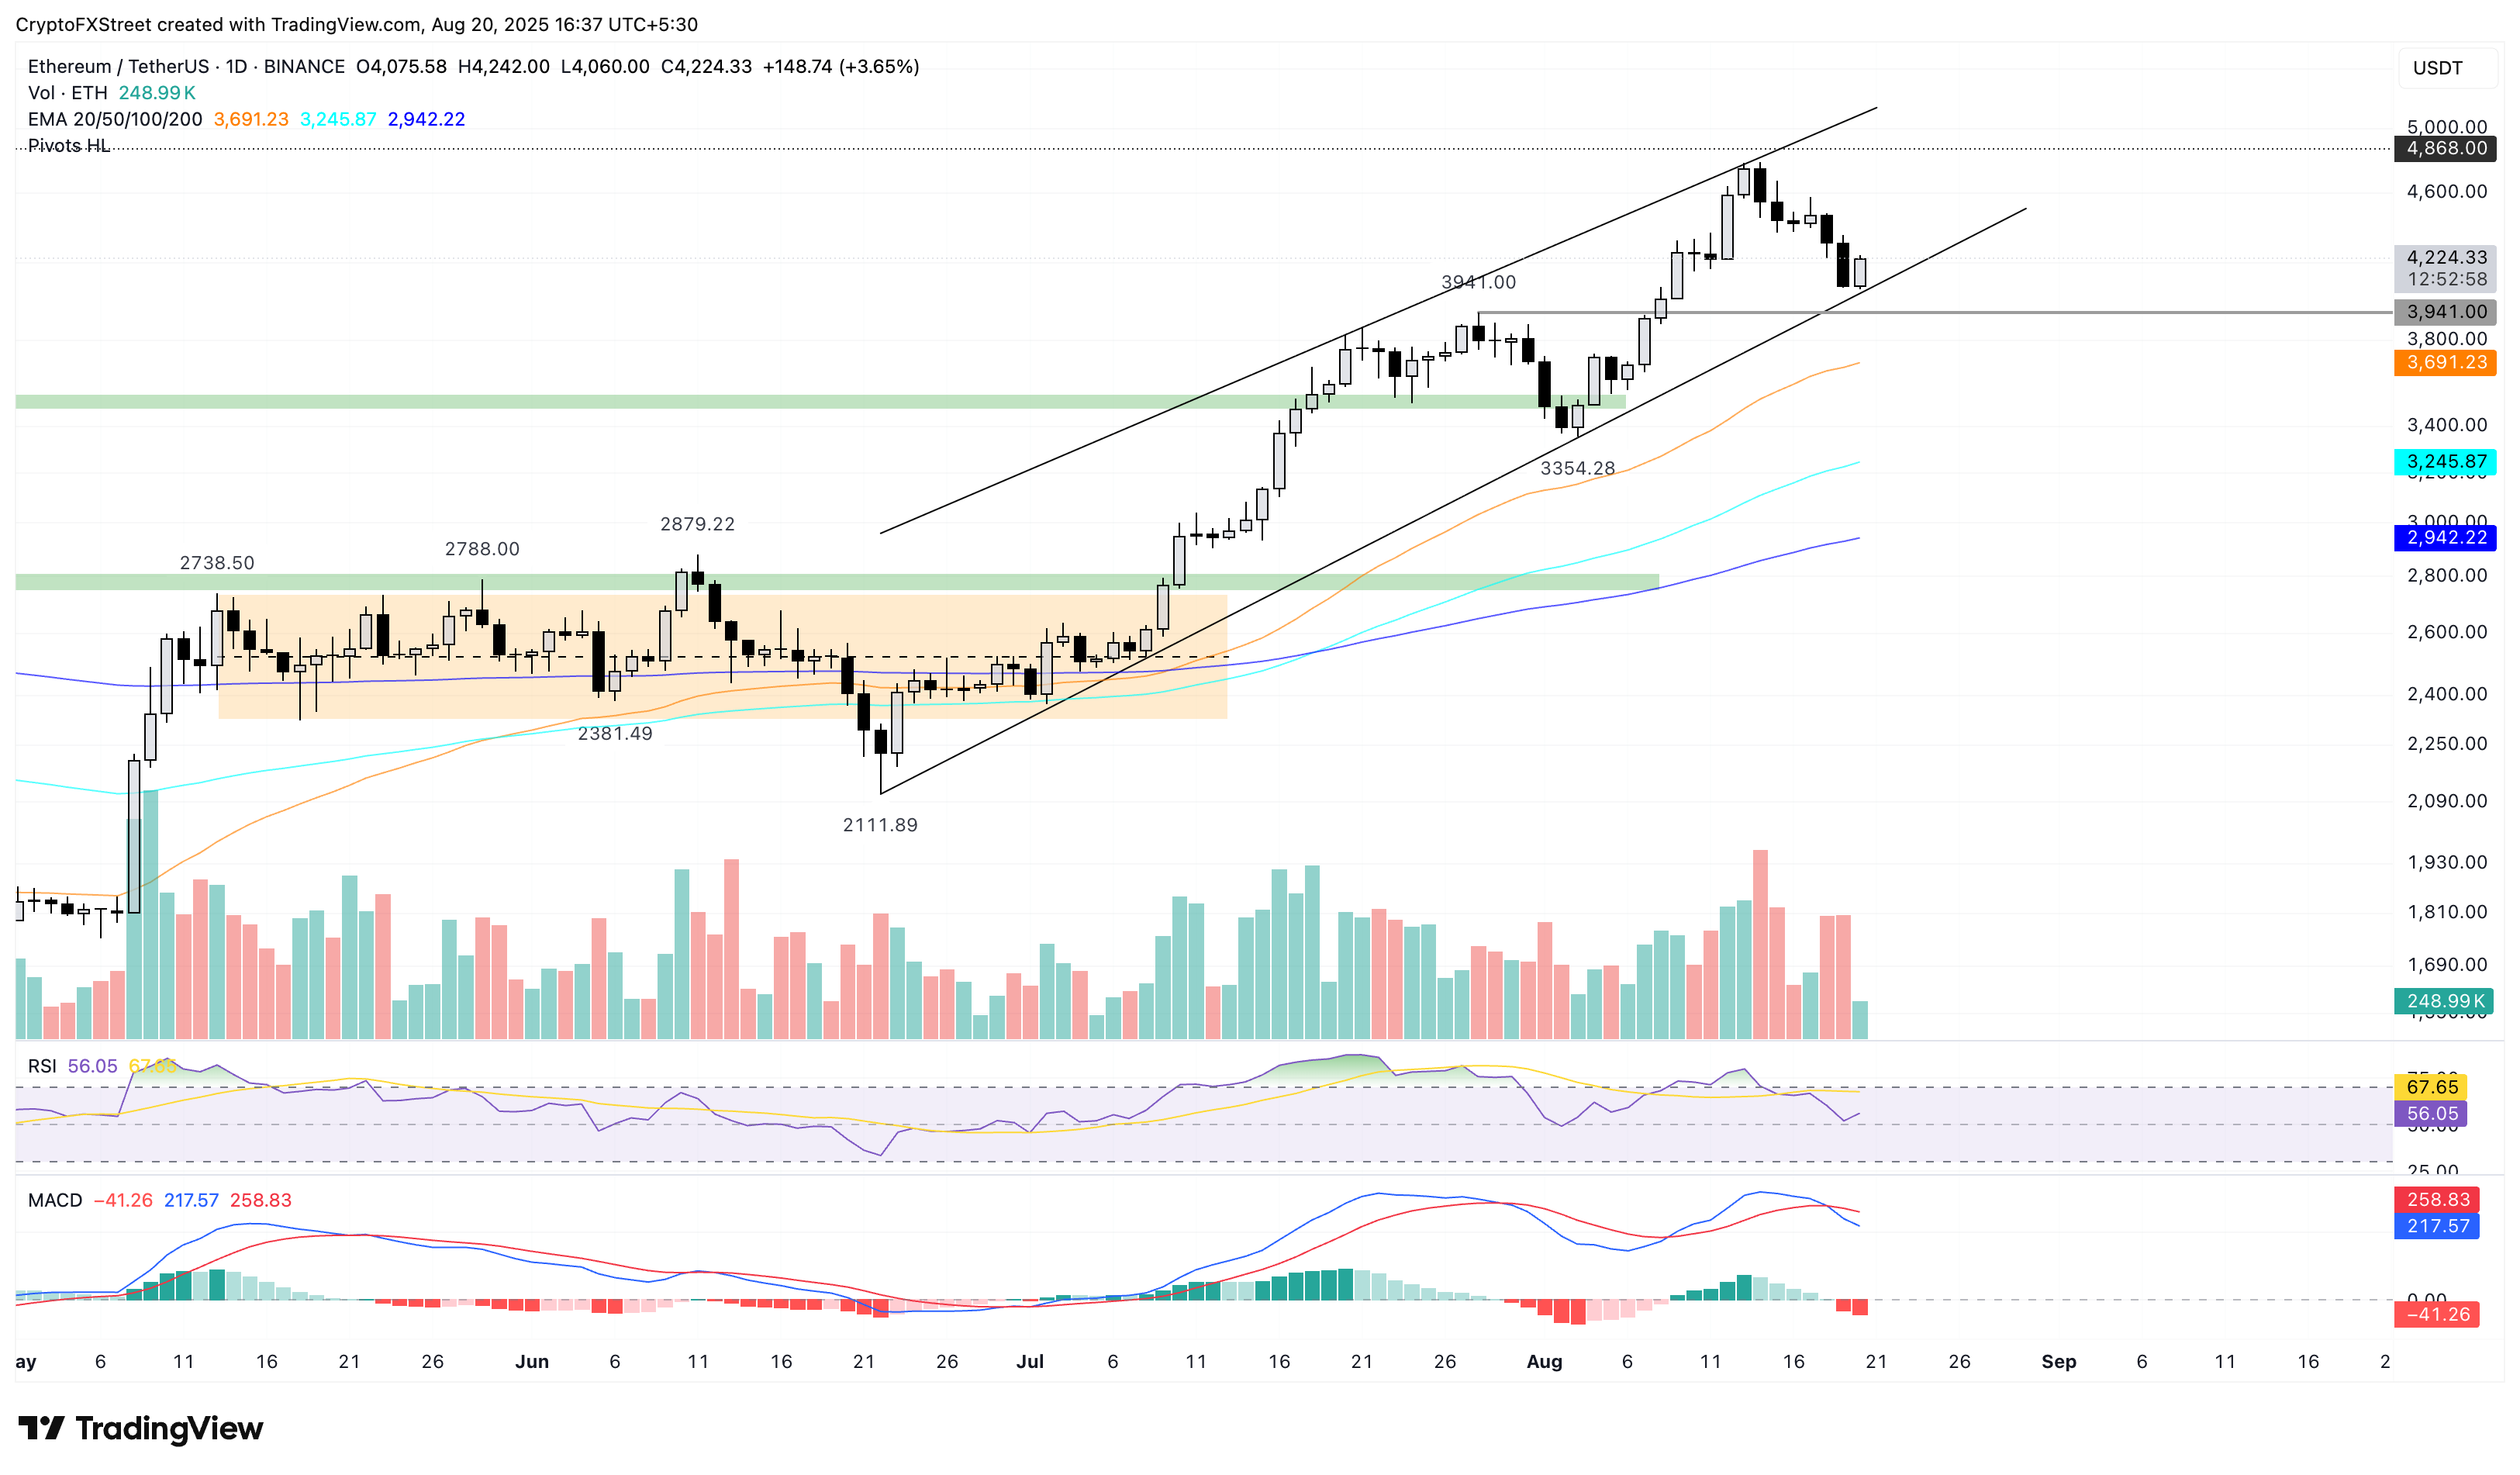
ETH/USDT daily price chart.
On the downside, a slip below the support trendline near the $4,000 psychological support would risk crashing the $3,941 support level.
XRP bulls eye to reclaim the 50-day EMA
Ripple’s XRP broke below the support confluence of a rising trendline, the 50-day EMA, and a Fibonacci retracement near the $3.00 psychological level, with a 6.56% drop on Tuesday. At the time of writing, XRP recovers over 1% on Wednesday, with bulls eyeing a reclaim of the 50-day EMA at $2.93.
If XRP resurfaces above this dynamic average line, it could test the 38.2% Fibonacci retracement level at $2.99, which is drawn from $1.90 on June 22 to $3.66 on July 18.
The RSI reads 42 on the daily chart, holding below the halfway line as buying pressure remains on the lower side. Additionally, the MACD and its signal line are edging closer to the zero line as bearish momentum increases.
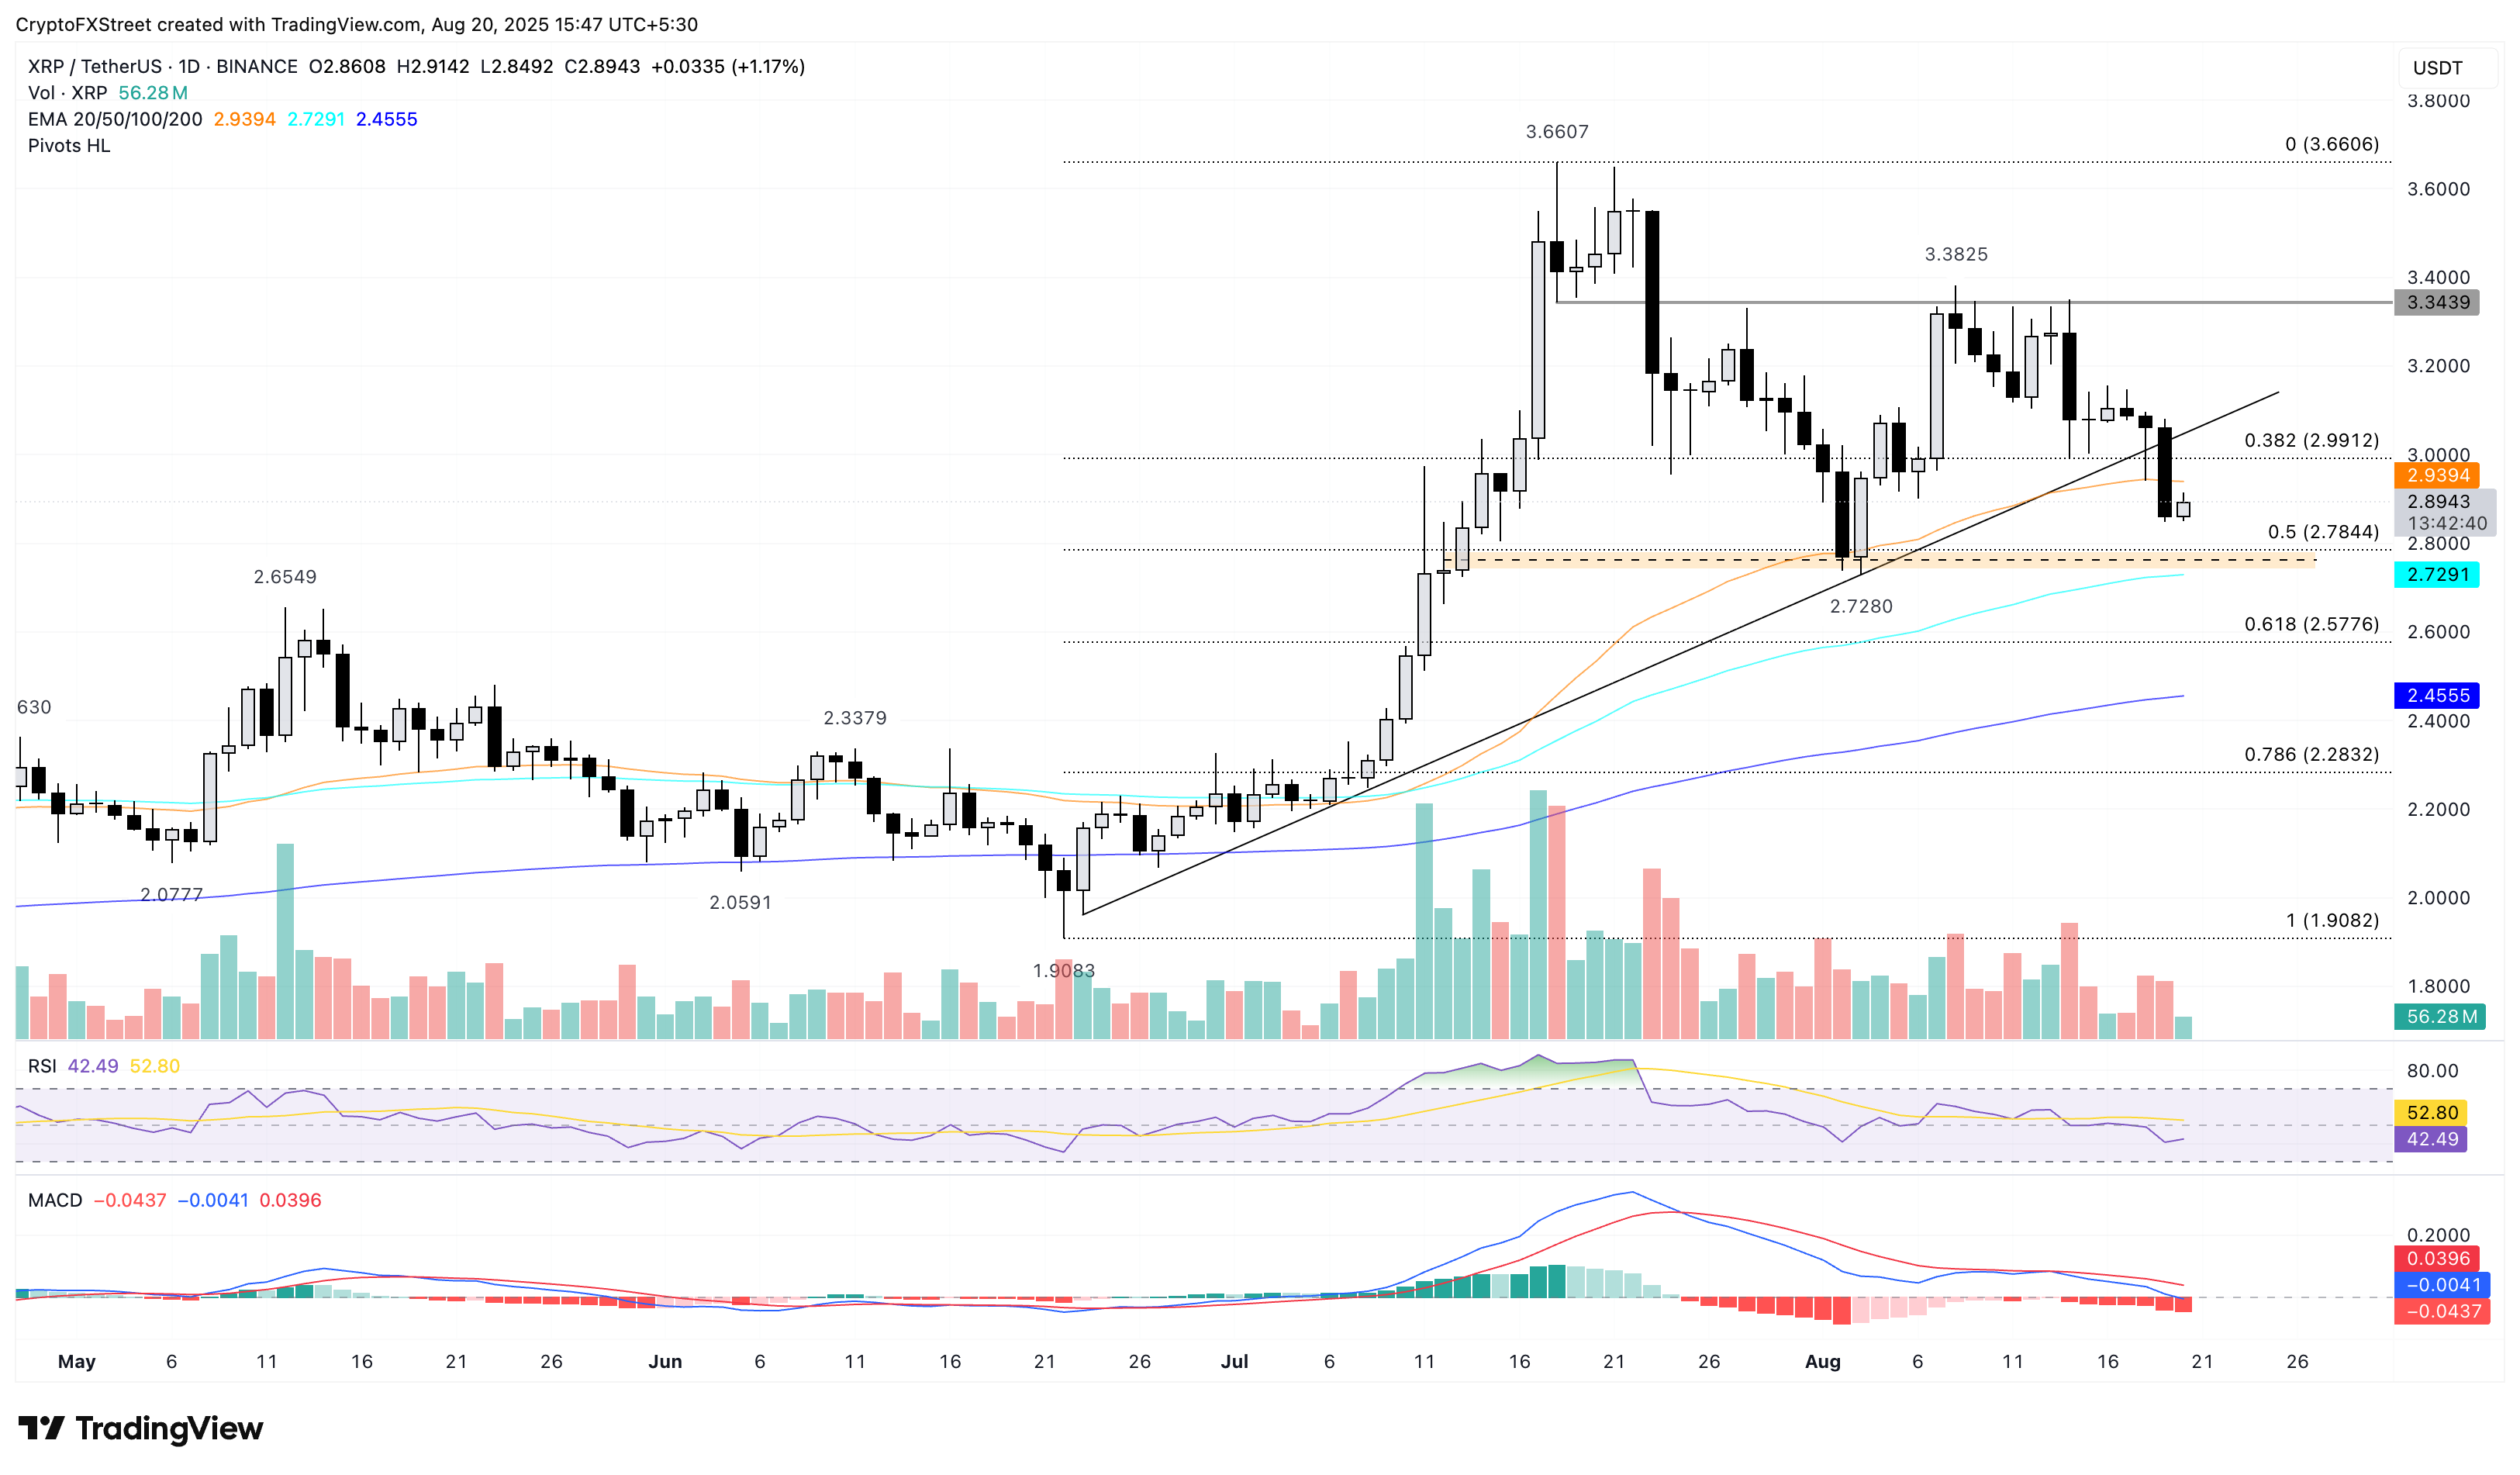
XRP/USDT daily price chart.
Looking down, the immediate support lies at the 50% Fibonacci retracement level at $2.78.
Bitcoin, altcoins, stablecoins FAQs
Bitcoin is the largest cryptocurrency by market capitalization, a virtual currency designed to serve as money. This form of payment cannot be controlled by any one person, group, or entity, which eliminates the need for third-party participation during financial transactions.
Altcoins are any cryptocurrency apart from Bitcoin, but some also regard Ethereum as a non-altcoin because it is from these two cryptocurrencies that forking happens. If this is true, then Litecoin is the first altcoin, forked from the Bitcoin protocol and, therefore, an “improved” version of it.
Stablecoins are cryptocurrencies designed to have a stable price, with their value backed by a reserve of the asset it represents. To achieve this, the value of any one stablecoin is pegged to a commodity or financial instrument, such as the US Dollar (USD), with its supply regulated by an algorithm or demand. The main goal of stablecoins is to provide an on/off-ramp for investors willing to trade and invest in cryptocurrencies. Stablecoins also allow investors to store value since cryptocurrencies, in general, are subject to volatility.
Bitcoin dominance is the ratio of Bitcoin's market capitalization to the total market capitalization of all cryptocurrencies combined. It provides a clear picture of Bitcoin’s interest among investors. A high BTC dominance typically happens before and during a bull run, in which investors resort to investing in relatively stable and high market capitalization cryptocurrency like Bitcoin. A drop in BTC dominance usually means that investors are moving their capital and/or profits to altcoins in a quest for higher returns, which usually triggers an explosion of altcoin rallies.
You May Also Like

Securities Fraud Investigation Into Corcept Therapeutics Incorporated (CORT) Announced – Shareholders Who Lost Money Urged To Contact Glancy Prongay Wolke & Rotter LLP, a Leading Securities Fraud Law Firm

Microsoft Corp. $MSFT blue box area offers a buying opportunity
