66% Drop? Head-and Shoulders Pattern Hints at Another Painful Correction for PEPE
Pepe (PEPE) has broken below a key neckline support, completing a textbook head-and-shoulders pattern. The move suggests further downside risk.
Meanwhile, the price is around $0.00000558 at press time, with a weekly drop of over 17%.
Pattern Structure and Target Projections
The chart posted by Ali Martinez shows a well-defined head and shoulders formation. The neckline support broke at approximately $0.0000065, triggering a bearish move. This structure is typically known for reversing uptrends when confirmed by a neckline break.
The projected target from this breakdown points toward $0.00000185. This is based on the measured move from the top of the head to the neckline and confirmed with Fibonacci levels. The chart shows possible support at $0.00000490 and $0.00000333 before reaching lower targets.
Price and Volume Trends
PEPE’s price continues to trade below its 9-day EMA. This keeps momentum tilted to the downside. The recent decline in volume adds to this view. Daily trading volume is now near $310 million, a drop of more than 50% compared to the previous day.
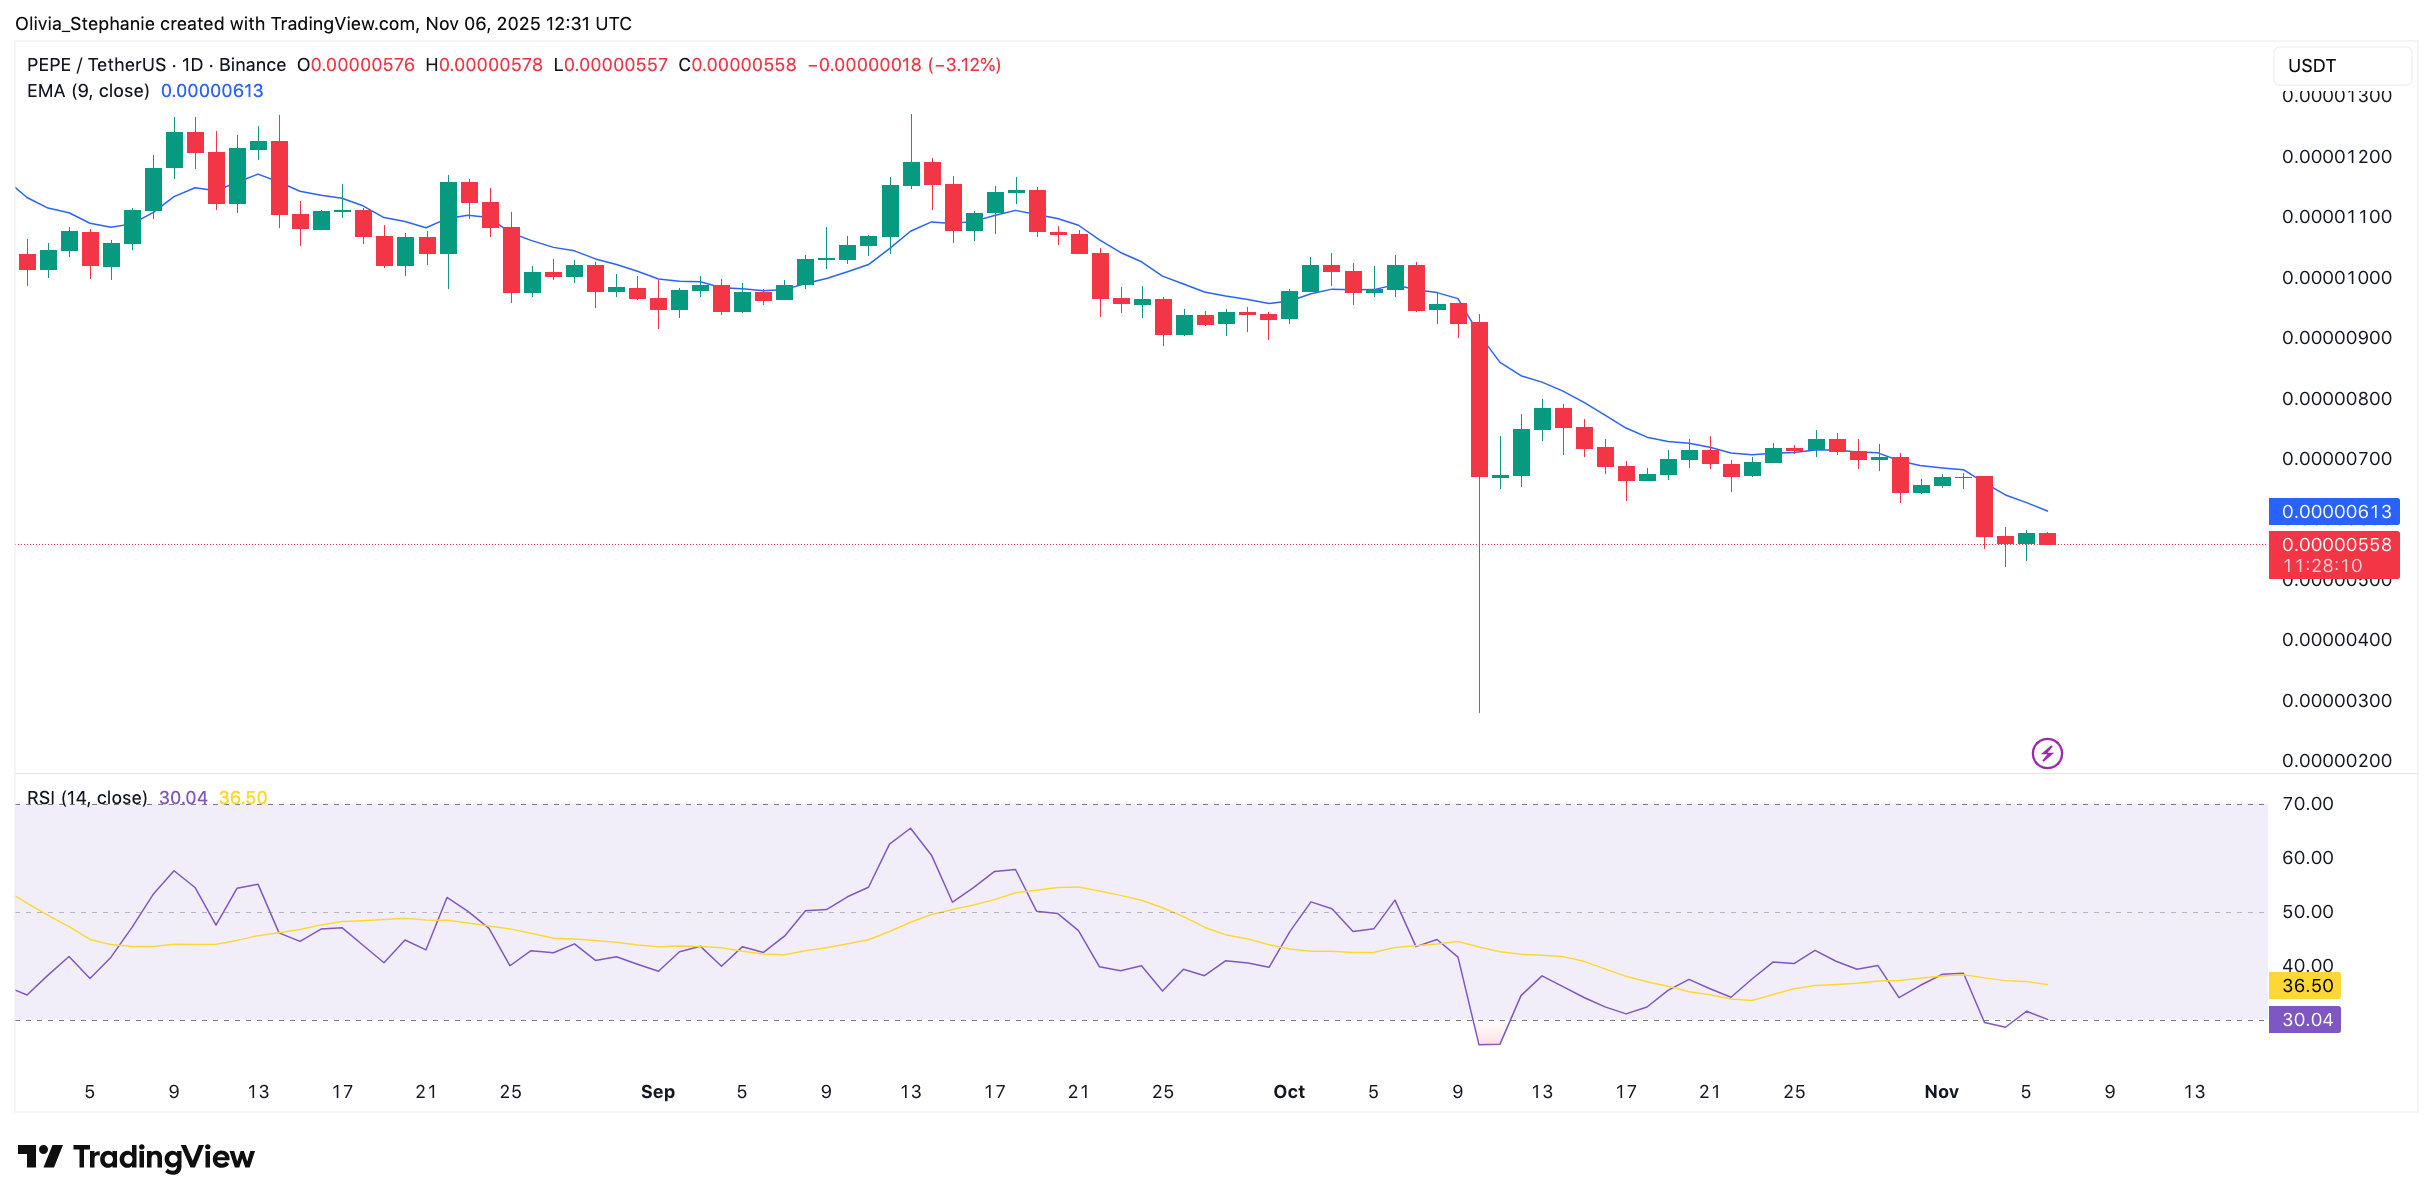 Source: TradingView
On the RSI, the reading sits at 30. This level is near oversold territory but has not yet triggered a reversal. Unless volume returns or buyers step in, the trend may remain weak in the near term.
Funding Rates Turning Positive
Data from Coinalyze shows the aggregated funding rate is now +0.0100. The predicted rate is +0.0056. Both metrics have flipped from negative to positive, suggesting some traders are positioning for a bounce. These figures often indicate a shift in sentiment, especially after a strong drop.
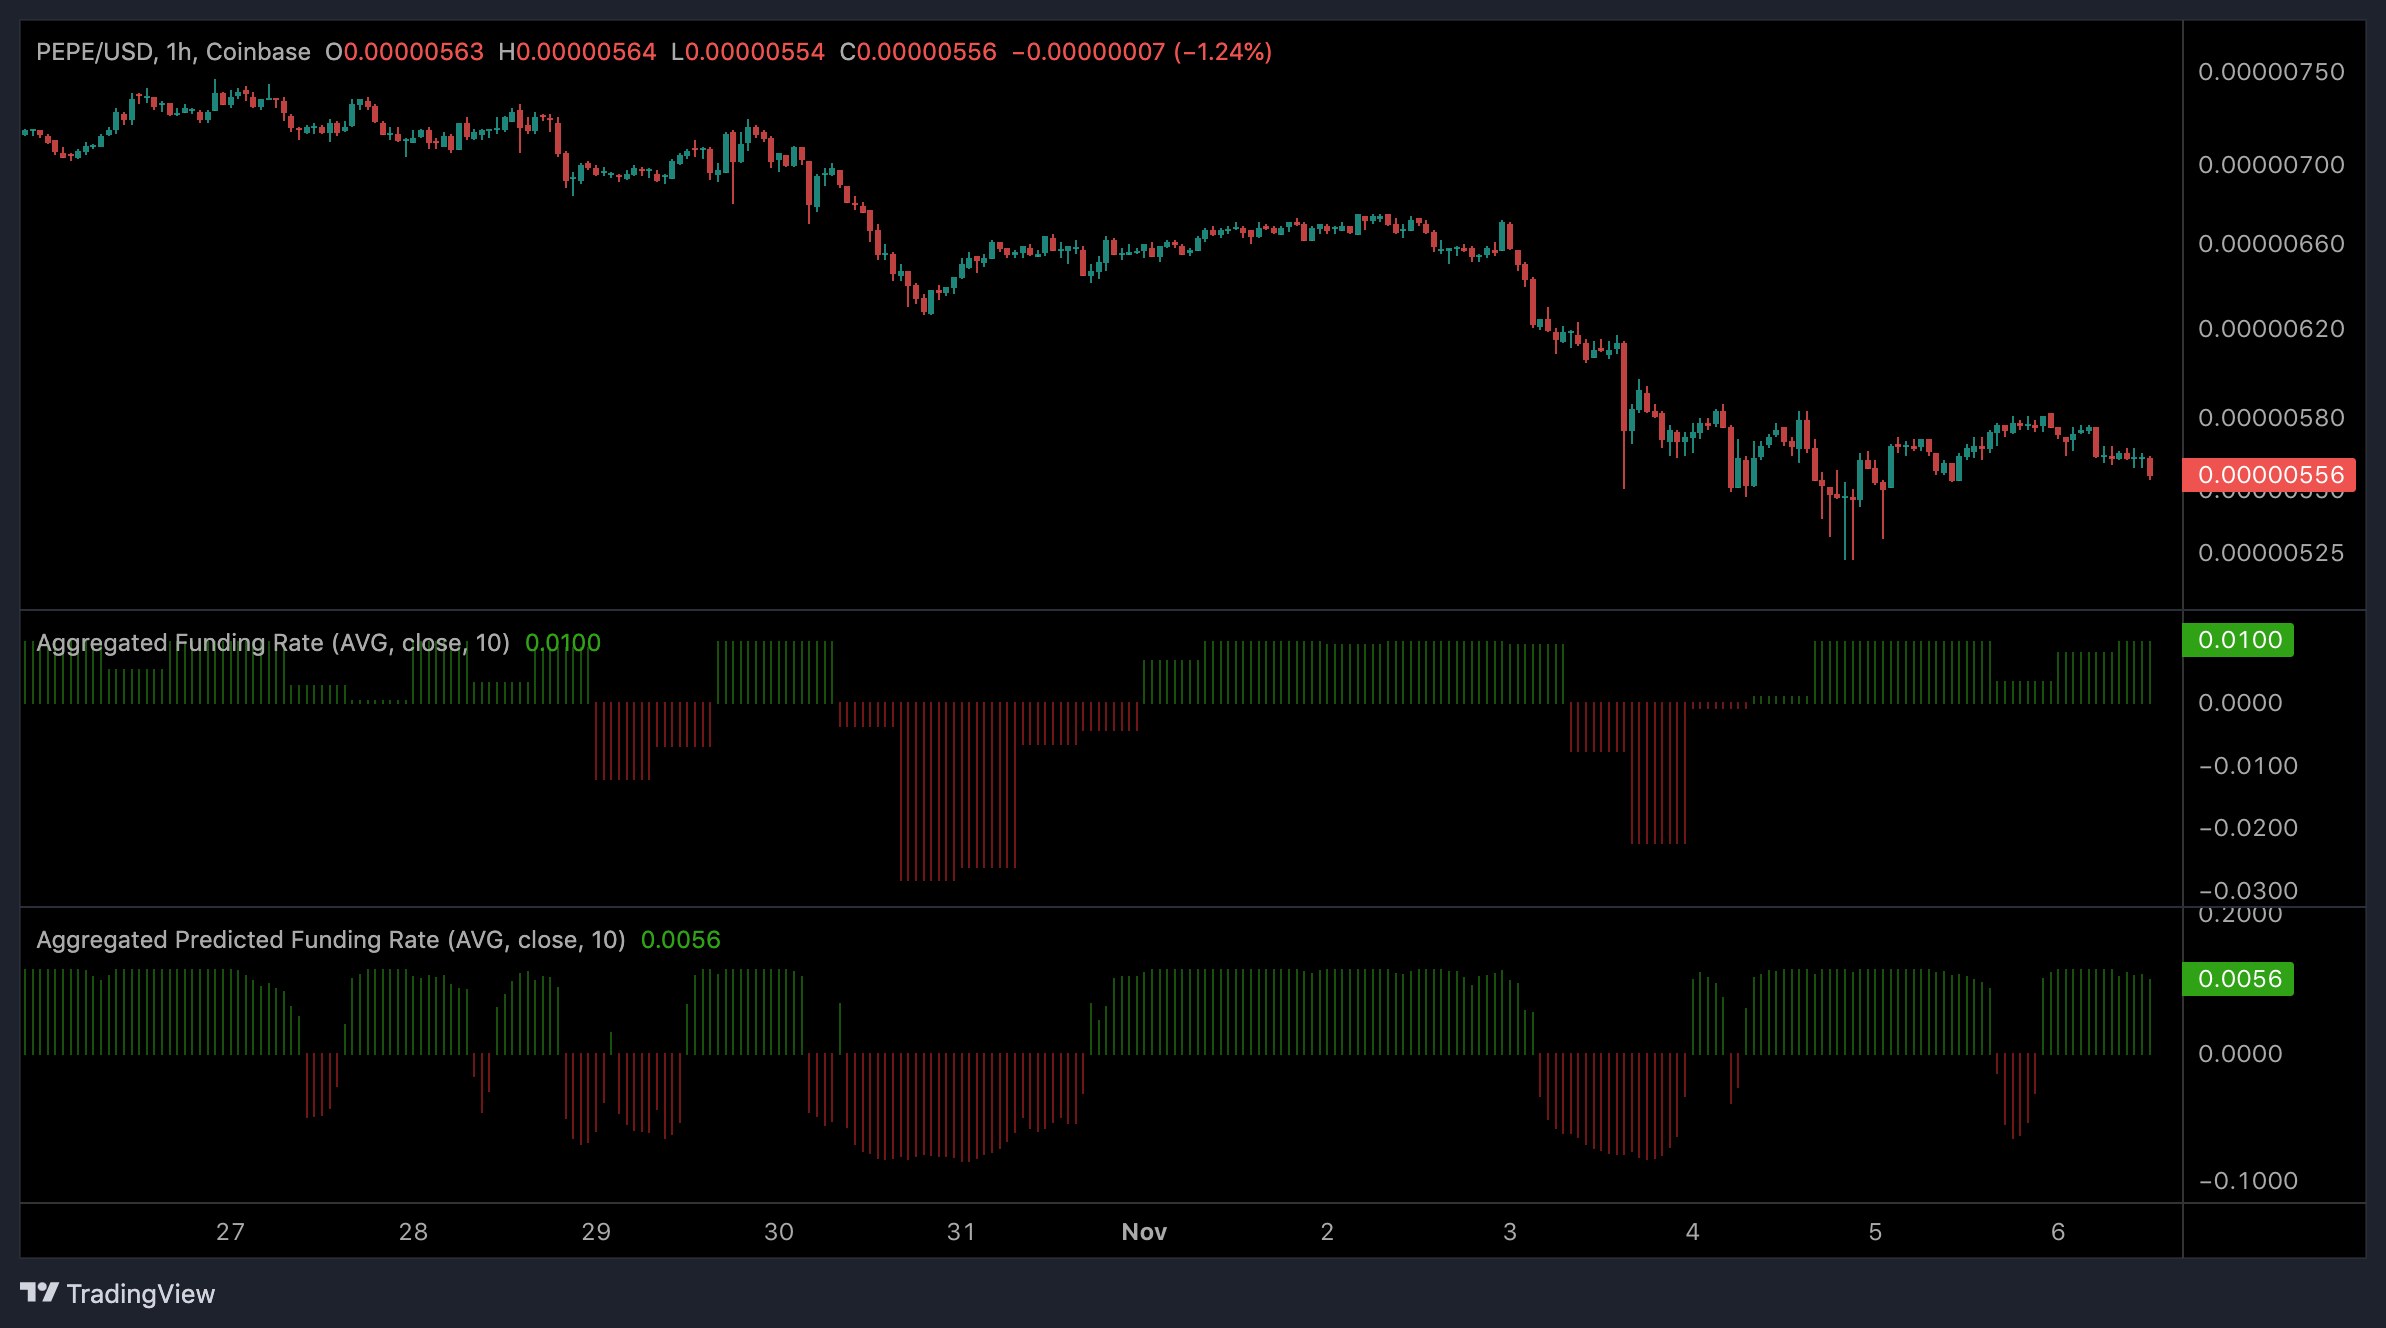 Source: Coinalyze
However, the price remains below resistance. Until levels above $0.0000065 are reclaimed, the pattern’s structure remains in play.
The current structure suggests sellers remain in control. Until the asset builds above key resistance, the next move toward the $0.00000185 target remains on the table.
The post 66% Drop? Head-and Shoulders Pattern Hints at Another Painful Correction for PEPE appeared first on CryptoPotato.
You May Also Like

Tech Influence on Markets: A Deeper Impact Than the Dot-Com Era
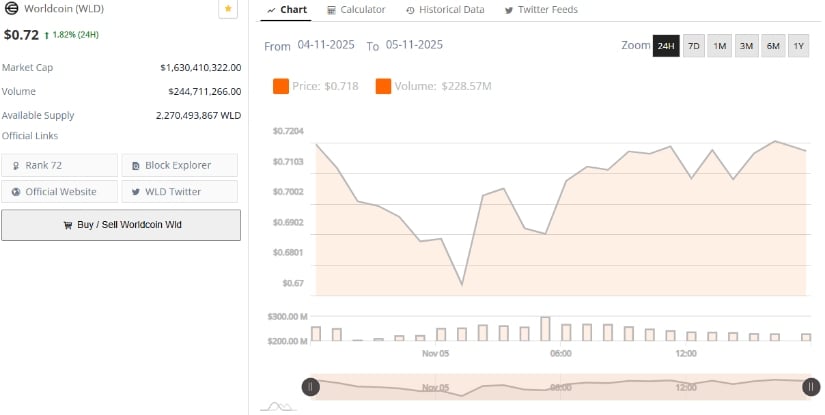
Worldcoin Price Prediction: WLD Tests $0.70 Support as Downtrend Extends