Bitcoin price has confirmed a bearish inverse cup and handle pattern as institutional demand for the asset waned amidst market uncertainty, and it fell near $70Bitcoin price has confirmed a bearish inverse cup and handle pattern as institutional demand for the asset waned amidst market uncertainty, and it fell near $70

Bitcoin sell off: BTC price falls near $70,000 amid market uncertainty

2026/02/05 16:16
3 min read

Bitcoin price has confirmed a bearish inverse cup and handle pattern as institutional demand for the asset waned amidst market uncertainty, and it fell near $70,000.

Summary
  • Bitcoin price is down nearly 20% over the past week.
  • Bitcoin ETFs shed $2.9 billion over the past 12 trading days.
  • A bearish inverse cup and handle pattern has been confirmed on the daily chart.

Bitcoin (BTC) price fell 7.2% to $70,119 on Thursday, Feb. 5, its lowest point since Nov. 6, 2024. Trading at $70,555 at the time of writing, the bellwether has fallen 20% over the past 7 days and 26% from its year-to-date highs.

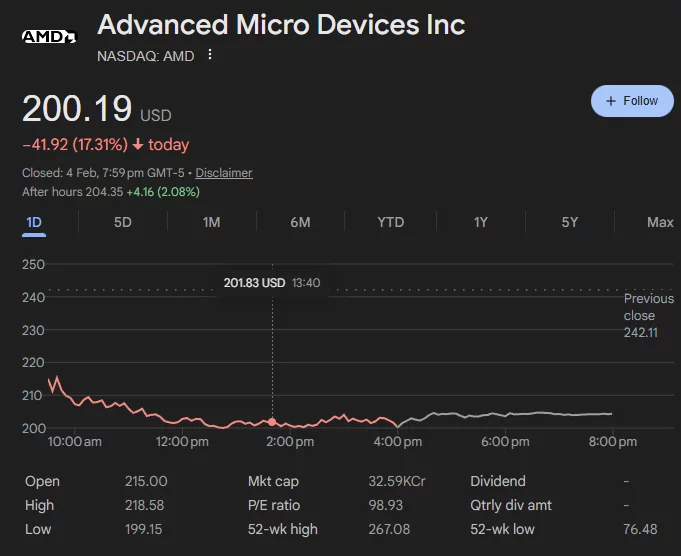
Bitcoin declined after losing significant support levels this year, influenced by macroeconomic and geopolitical factors that reduced investor appetite for risk assets. The bellwether’s recent drop mirrored the performance of the tech-focused Nasdaq index, following a weak sales forecast from chipmaker AMD and disappointing U.S. employment figures.

AMD shares dropped 17.3% on Tuesday after its first-quarter revenue guidance missed analyst expectations, sparking a sell-off in the semiconductor sector, while rival Nvidia fell 3.4%. Market sentiment also weakened due to poor labor data released on Wednesday, showing that U.S. private payrolls increased by only 22,000 in January, significantly less than the 45,000 jobs economists anticipated.

AMD shares tanked on Wednesday.

Investors now fear that the BTC price could see more downside ahead as institutional demand for the asset appears to have eroded in recent weeks.

Data from SoSoValue shows that the 12 U.S. spot Bitcoin ETFs recorded over $2.9 billion in combined outflows over the past 12 trading days. The monthly tally reveals that these investment products have been recording back-to-back outflows since November 2025, with total withdrawals reaching approximately $5.9 billion since that time.

These investment products previously acted as a safety net for Bitcoin prices during market downturns by providing steady buying pressure from big investors. The lack of demand could serve as a headwind for future price growth.

BTC price analysis

Looking at the daily chart, it appears that BTC price has confirmed a multi-month inverse cup and handle pattern that had been forming since April 2025, as reported by crypto.news earlier. This pattern is formed with an upside-down rounded top representing the cup and a shorter upward-sloping consolidation period forming the handle.

Bitcoin price has confirmed an inverse cup and handle pattern on the daily chart.

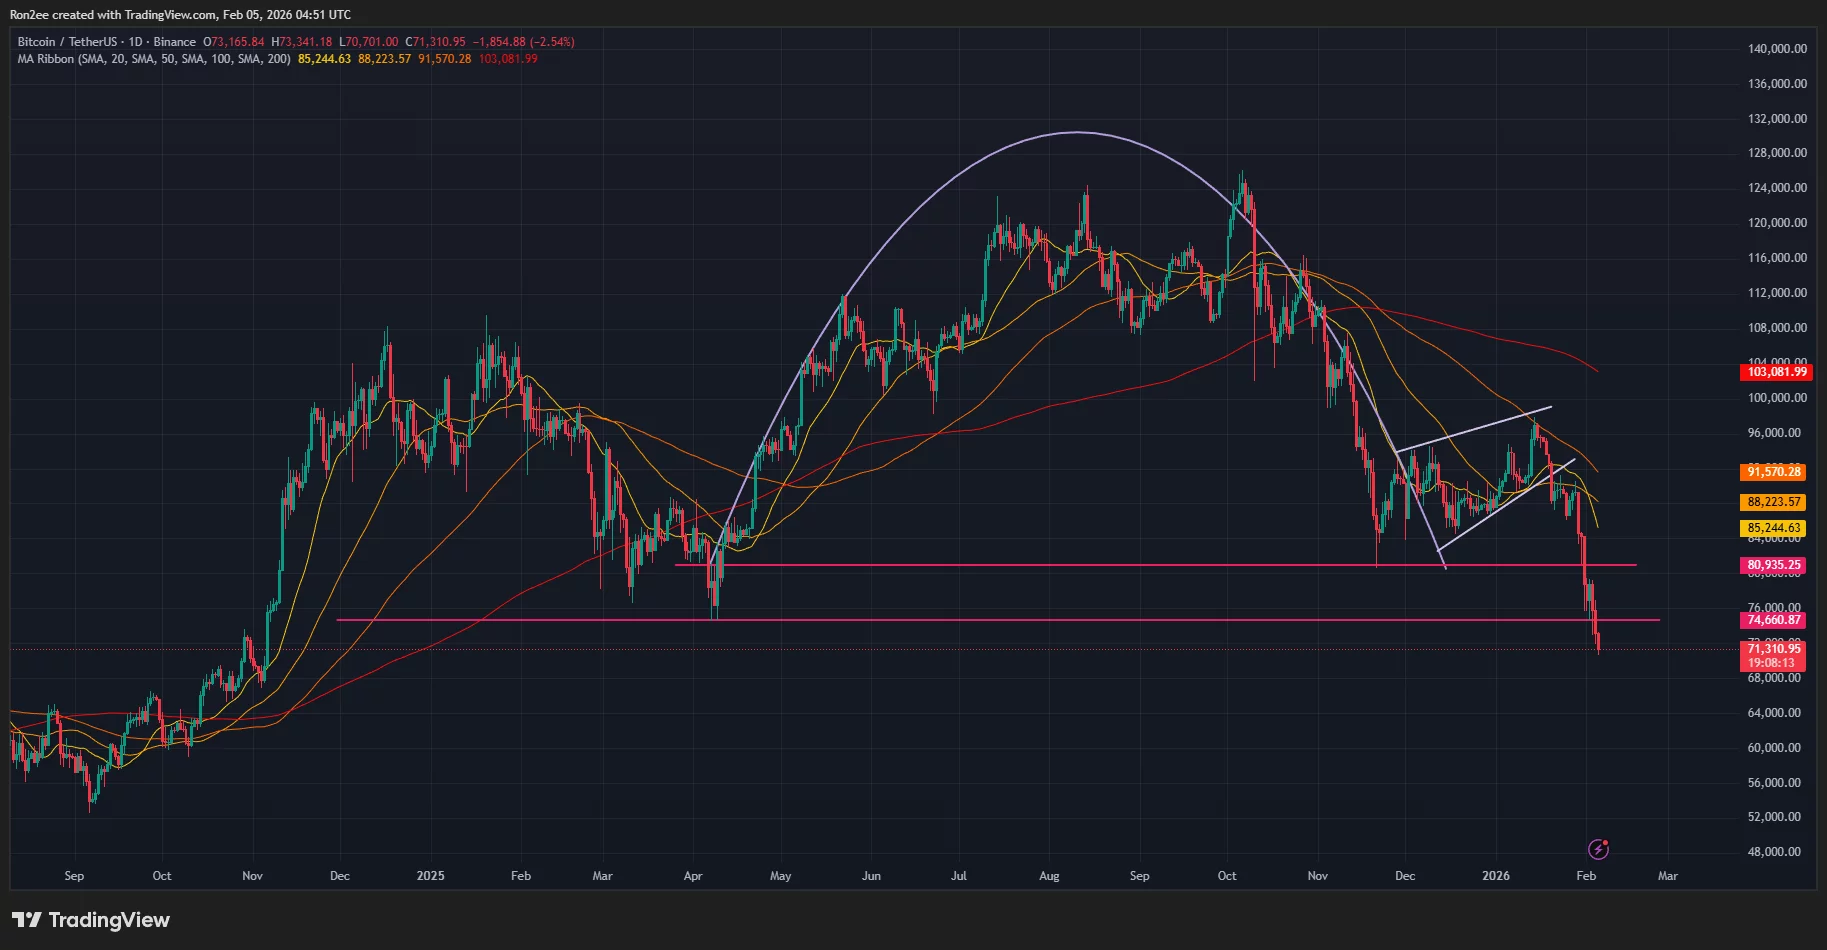
Upon confirmation through a break below the neckline of the formation, these patterns have historically tended to lead to sustained downside for long periods.

More importantly, BTC price has fallen below all of the key moving averages, with the 20-day and 50-day indicators forming a bearish crossover. It has also fallen below the $75,000 support level and under its April 9 low of $74,660.

Hence, the BTC price forecast outlook looks highly bearish at least in the short term. It could likely lose the $70,000 support, which could open the door to even deeper liquidity pockets near $65,000 or $60,000 as sellers take control of the market.

Disclosure: This article does not represent investment advice. The content and materials featured on this page are for educational purposes only.

Market Opportunity
Bitcoin Logo
Bitcoin Price(BTC)
$68,984.36
$68,984.36$68,984.36
+0.41%
USD
Bitcoin (BTC) Live Price Chart
Disclaimer: The articles reposted on this site are sourced from public platforms and are provided for informational purposes only. They do not necessarily reflect the views of MEXC. All rights remain with the original authors. If you believe any content infringes on third-party rights, please contact service@support.mexc.com for removal. MEXC makes no guarantees regarding the accuracy, completeness, or timeliness of the content and is not responsible for any actions taken based on the information provided. The content does not constitute financial, legal, or other professional advice, nor should it be considered a recommendation or endorsement by MEXC.

You May Also Like

Is Doge Losing Steam As Traders Choose Pepeto For The Best Crypto Investment?

Is Doge Losing Steam As Traders Choose Pepeto For The Best Crypto Investment?

The post Is Doge Losing Steam As Traders Choose Pepeto For The Best Crypto Investment? appeared on BitcoinEthereumNews.com. Crypto News 17 September 2025 | 17:39 Is dogecoin really fading? As traders hunt the best crypto to buy now and weigh 2025 picks, Dogecoin (DOGE) still owns the meme coin spotlight, yet upside looks capped, today’s Dogecoin price prediction says as much. Attention is shifting to projects that blend culture with real on-chain tools. Buyers searching “best crypto to buy now” want shipped products, audits, and transparent tokenomics. That frames the true matchup: dogecoin vs. Pepeto. Enter Pepeto (PEPETO), an Ethereum-based memecoin with working rails: PepetoSwap, a zero-fee DEX, plus Pepeto Bridge for smooth cross-chain moves. By fusing story with tools people can use now, and speaking directly to crypto presale 2025 demand, Pepeto puts utility, clarity, and distribution in front. In a market where legacy meme coin leaders risk drifting on sentiment, Pepeto’s execution gives it a real seat in the “best crypto to buy now” debate. First, a quick look at why dogecoin may be losing altitude. Dogecoin Price Prediction: Is Doge Really Fading? Remember when dogecoin made crypto feel simple? In 2013, DOGE turned a meme into money and a loose forum into a movement. A decade on, the nonstop momentum has cooled; the backdrop is different, and the market is far more selective. With DOGE circling ~$0.268, the tape reads bearish-to-neutral for the next few weeks: hold the $0.26 shelf on daily closes and expect choppy range-trading toward $0.29–$0.30 where rallies keep stalling; lose $0.26 decisively and momentum often bleeds into $0.245 with risk of a deeper probe toward $0.22–$0.21; reclaim $0.30 on a clean daily close and the downside bias is likely neutralized, opening room for a squeeze into the low-$0.30s. Source: CoinMarketcap / TradingView Beyond the dogecoin price prediction, DOGE still centers on payments and lacks native smart contracts; ZK-proof verification is proposed,…
Share
BitcoinEthereumNews2025/09/18 00:14
US Bitcoin and Ethereum ETFs See Sharp Outflows as Capital Moves Overseas

US Bitcoin and Ethereum ETFs See Sharp Outflows as Capital Moves Overseas

US Bitcoin and Ethereum ETFs have suffered major outflows throughout most of 2024. Investors are redirecting capital toward international equities and higher-
Share
Coinstats2026/02/14 07:08
SHIB Price Analysis for February 13

SHIB Price Analysis for February 13

The post SHIB Price Analysis for February 13 appeared on BitcoinEthereumNews.com. Original U.Today article Can traders expect SHIB to test the $0.0000070 area this
Share
BitcoinEthereumNews2026/02/14 07:30