Bitcoin is trading at around $118,815, showing modest daily gains, but on-chain and macro indicators suggest the market may be entering a more cautious phase. According to a July 29 analysis from CryptoQuant contributor Arab Chain, the Coinbase Premium Index…Bitcoin is trading at around $118,815, showing modest daily gains, but on-chain and macro indicators suggest the market may be entering a more cautious phase. According to a July 29 analysis from CryptoQuant contributor Arab Chain, the Coinbase Premium Index…

Bitcoin faces pullback risk as U.S. investor demand slows

3 min read

Bitcoin is trading at around $118,815, showing modest daily gains, but on-chain and macro indicators suggest the market may be entering a more cautious phase.

Summary
  • U.S. investor demand for Bitcoin is falling, based on the Coinbase Premium Index.
  • The July 30 Fed rate decision could affect Bitcoin’s short-term price direction.
  • Without renewed buying interest, Bitcoin may continue trading sideways or face a deeper pullback.

According to a July 29 analysis from CryptoQuant contributor Arab Chain, the Coinbase Premium Index has turned negative for the first time in two months, indicating weaker demand from U.S. buyers compared to global counterparts.

The index tracks the difference in Bitcoin’s (BTC) price on Coinbase versus other exchanges. It typically reflects institutional and retail sentiment in the U.S. 

The index had been positive throughout most of the rally from sub-$105,000 levels, showing strong buying interest from U.S. institutions and retail traders. But that excitement has subsided as Bitcoin surpassed $118,000 in value. 

The diminishing premium implies that American customers are waiting for lower entry points and are less likely to enter at the current prices. This change in attitude is accompanied by a rise in exchange inflows.

Recently, over 30,000 BTC have entered trading platforms, suggesting that selling pressure might be intensifying. Declining demand in other significant regions, such as South Korea, further slows momentum.

Markets eye Fed meeting for rate guidance

The Federal Reserve’s July 30 policy decision is one impending event that could have an impact on Bitcoin. Although markets generally anticipate that the Fed will maintain interest rates between 4.25% and 4.50%, risk sentiment may be impacted by the tone of Chair Jerome Powell’s press conference.

A hawkish outlook would likely increase selling pressure, especially if there isn’t an obvious catalyst to prop up cryptocurrency demand. However, if there is any indication of dovishness or that rate cuts may begin in September, Bitcoin may increase in the near future.

Bitcoin technical analysis

With $119,500 serving as short-term resistance, Bitcoin is trading close to the top of its Bollinger Band range on the daily chart. The relative strength index is at 60, which is neutral but not overbought, and the 20-day moving average is serving as support.

Bitcoin faces pullback risk as U.S. investor demand slows - 1

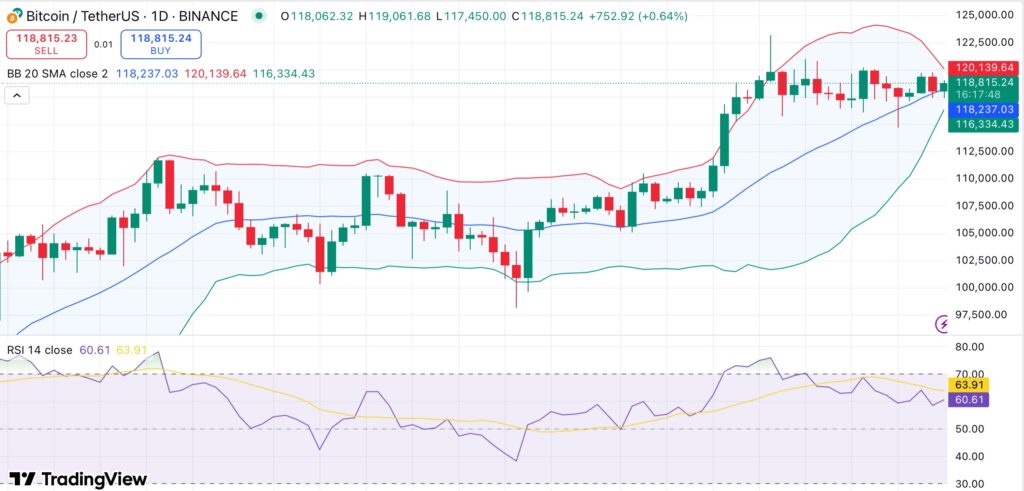
The MACD and awesome oscillator show weakening momentum, and the stochastic RSI is nearing oversold territory, suggesting a short-term bounce is possible if buying resumes.

Immediate support is at $118,000 while stronger support is found at $116,300.  A decline below these levels may pave the way for $112,000 or even $109,000. The price must break above $120,000 with strength to resume its upward trajectory.

However, in the absence of fresh interest from investors, Bitcoin might move sideways or undergo a more significant correction.

Market Opportunity
Moonveil Logo
Moonveil Price(MORE)
$0.0006796
$0.0006796$0.0006796
-9.77%
USD
Moonveil (MORE) Live Price Chart
Disclaimer: The articles reposted on this site are sourced from public platforms and are provided for informational purposes only. They do not necessarily reflect the views of MEXC. All rights remain with the original authors. If you believe any content infringes on third-party rights, please contact service@support.mexc.com for removal. MEXC makes no guarantees regarding the accuracy, completeness, or timeliness of the content and is not responsible for any actions taken based on the information provided. The content does not constitute financial, legal, or other professional advice, nor should it be considered a recommendation or endorsement by MEXC.

You May Also Like

Securities Fraud Investigation Into Corcept Therapeutics Incorporated (CORT) Announced – Shareholders Who Lost Money Urged To Contact Glancy Prongay Wolke & Rotter LLP, a Leading Securities Fraud Law Firm

Securities Fraud Investigation Into Corcept Therapeutics Incorporated (CORT) Announced – Shareholders Who Lost Money Urged To Contact Glancy Prongay Wolke & Rotter LLP, a Leading Securities Fraud Law Firm

LOS ANGELES–(BUSINESS WIRE)–Glancy Prongay Wolke & Rotter LLP, a leading national shareholder rights law firm, today announced that it has commenced an investigation
Share
AI Journal2026/02/05 04:00
Microsoft Corp. $MSFT blue box area offers a buying opportunity

Microsoft Corp. $MSFT blue box area offers a buying opportunity

The post Microsoft Corp. $MSFT blue box area offers a buying opportunity appeared on BitcoinEthereumNews.com. In today’s article, we’ll examine the recent performance of Microsoft Corp. ($MSFT) through the lens of Elliott Wave Theory. We’ll review how the rally from the April 07, 2025 low unfolded as a 5-wave impulse followed by a 3-swing correction (ABC) and discuss our forecast for the next move. Let’s dive into the structure and expectations for this stock. Five wave impulse structure + ABC + WXY correction $MSFT 8H Elliott Wave chart 9.04.2025 In the 8-hour Elliott Wave count from Sep 04, 2025, we saw that $MSFT completed a 5-wave impulsive cycle at red III. As expected, this initial wave prompted a pullback. We anticipated this pullback to unfold in 3 swings and find buyers in the equal legs area between $497.02 and $471.06 This setup aligns with a typical Elliott Wave correction pattern (ABC), in which the market pauses briefly before resuming its primary trend. $MSFT 8H Elliott Wave chart 7.14.2025 The update, 10 days later, shows the stock finding support from the equal legs area as predicted allowing traders to get risk free. The stock is expected to bounce towards 525 – 532 before deciding if the bounce is a connector or the next leg higher. A break into new ATHs will confirm the latter and can see it trade higher towards 570 – 593 area. Until then, traders should get risk free and protect their capital in case of a WXY double correction. Conclusion In conclusion, our Elliott Wave analysis of Microsoft Corp. ($MSFT) suggested that it remains supported against April 07, 2025 lows and bounce from the blue box area. In the meantime, keep an eye out for any corrective pullbacks that may offer entry opportunities. By applying Elliott Wave Theory, traders can better anticipate the structure of upcoming moves and enhance risk management in volatile markets. Source: https://www.fxstreet.com/news/microsoft-corp-msft-blue-box-area-offers-a-buying-opportunity-202509171323
Share
BitcoinEthereumNews2025/09/18 03:50
Over 80% of 135 Ethereum L2s record below 1 user operation per second

Over 80% of 135 Ethereum L2s record below 1 user operation per second

The post Over 80% of 135 Ethereum L2s record below 1 user operation per second  appeared on BitcoinEthereumNews.com. Ethereum’s L2s are not doing too well. Data
Share
BitcoinEthereumNews2026/02/05 03:52