The NFT market recorded $61.5 million in sales volume over the past week, posting a modest 1.52% increase from the previous period. While the sales figures showThe NFT market recorded $61.5 million in sales volume over the past week, posting a modest 1.52% increase from the previous period. While the sales figures show

NFT buyers rise 120% despite sales staying flat at $61.5 million

2026/01/17 13:50
3 min read

The NFT market recorded $61.5 million in sales volume over the past week, posting a modest 1.52% increase from the previous period.

Summary
  • NFT sales hit $61.5M, while buyers surged 121% and sellers rose nearly 99%.
  • Ethereum led blockchains with $29M in NFT sales and a 421% jump in buyers.
  • Bitcoin NFTs dominated top sales as BTC reclaimed $95K and ETH crossed $3.2K.

While the sales figures show minimal movement, the real story lies in market participation. NFT buyers jumped 120.90% to reach 134,743, while sellers increased by 98.69% to 111,756.

This has happened at a time when Bitcoin (BTC) has staged a recovery to the $95,000 level, while Ethereum (ETH) has reclaimed the $3,200 mark.

The global crypto market cap now stands at $3.22 trillion, up from last week’s $3.09 trillion.

Ethereum maintains dominance with $29 million in sales

Ethereum continues to lead all blockchains with $29.05 million in NFT sales, posting a 13.51% gain over the seven-day period.

The network saw 17,389 buyers, up by 420.94% from the prior week. Wash trading on Ethereum totaled $3.88 million during this timeframe.

Bitcoin claimed second place among blockchains with $9.33 million in sales, though this is a 12.69% decline from the prior week. The network drew 5,185 buyers, up 202.69% week-over-week.

Blockchains by NFT sales

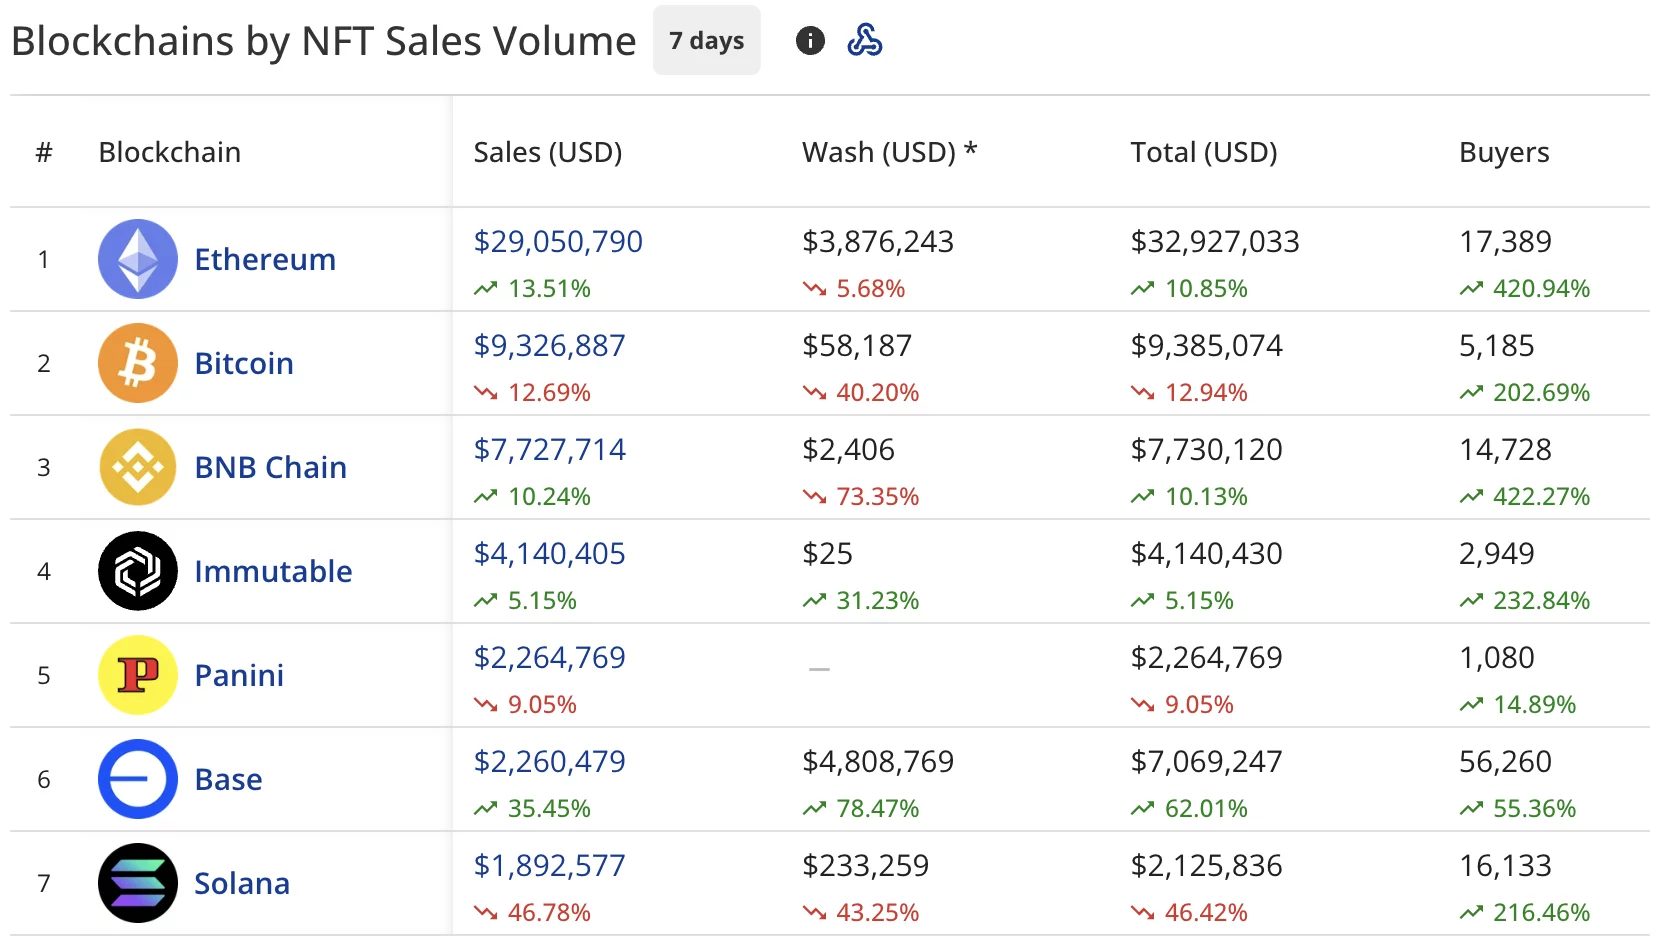
BNB Chain (BNB) ranked third with $7.73 million in sales, climbing 10.24% and drawing 14,728 buyers who increased by 422.27%.

Immutable (IMX) secured fourth position at $4.14 million in sales, up 5.15%, while Panini rounded out the top five with $2.26 million, down 9.05%.

Base blockchain recorded $2.26 million in sales with a 35.45% gain, while Solana (SOL) posted $1.89 million in sales but suffered a steep 46.78% decline compared to the previous week.

YES BOND tops collection rankings

YES BOND on BNB Chain dominated the collection rankings with $3.26 million in sales, climbing 19.35% over the week. The collection processed 1,622 transactions from 1,299 buyers.

CryptoPunks took second place with $2.73 million in sales despite a 23.81% drop. The blue-chip Ethereum collection completed 28 transactions from 20 buyers. Ape.bond Bonds landed in third with $2.48 million in sales, surging 43.47%.

NFT buyers rise 120% despite sales staying flat at $61.5 million - 1

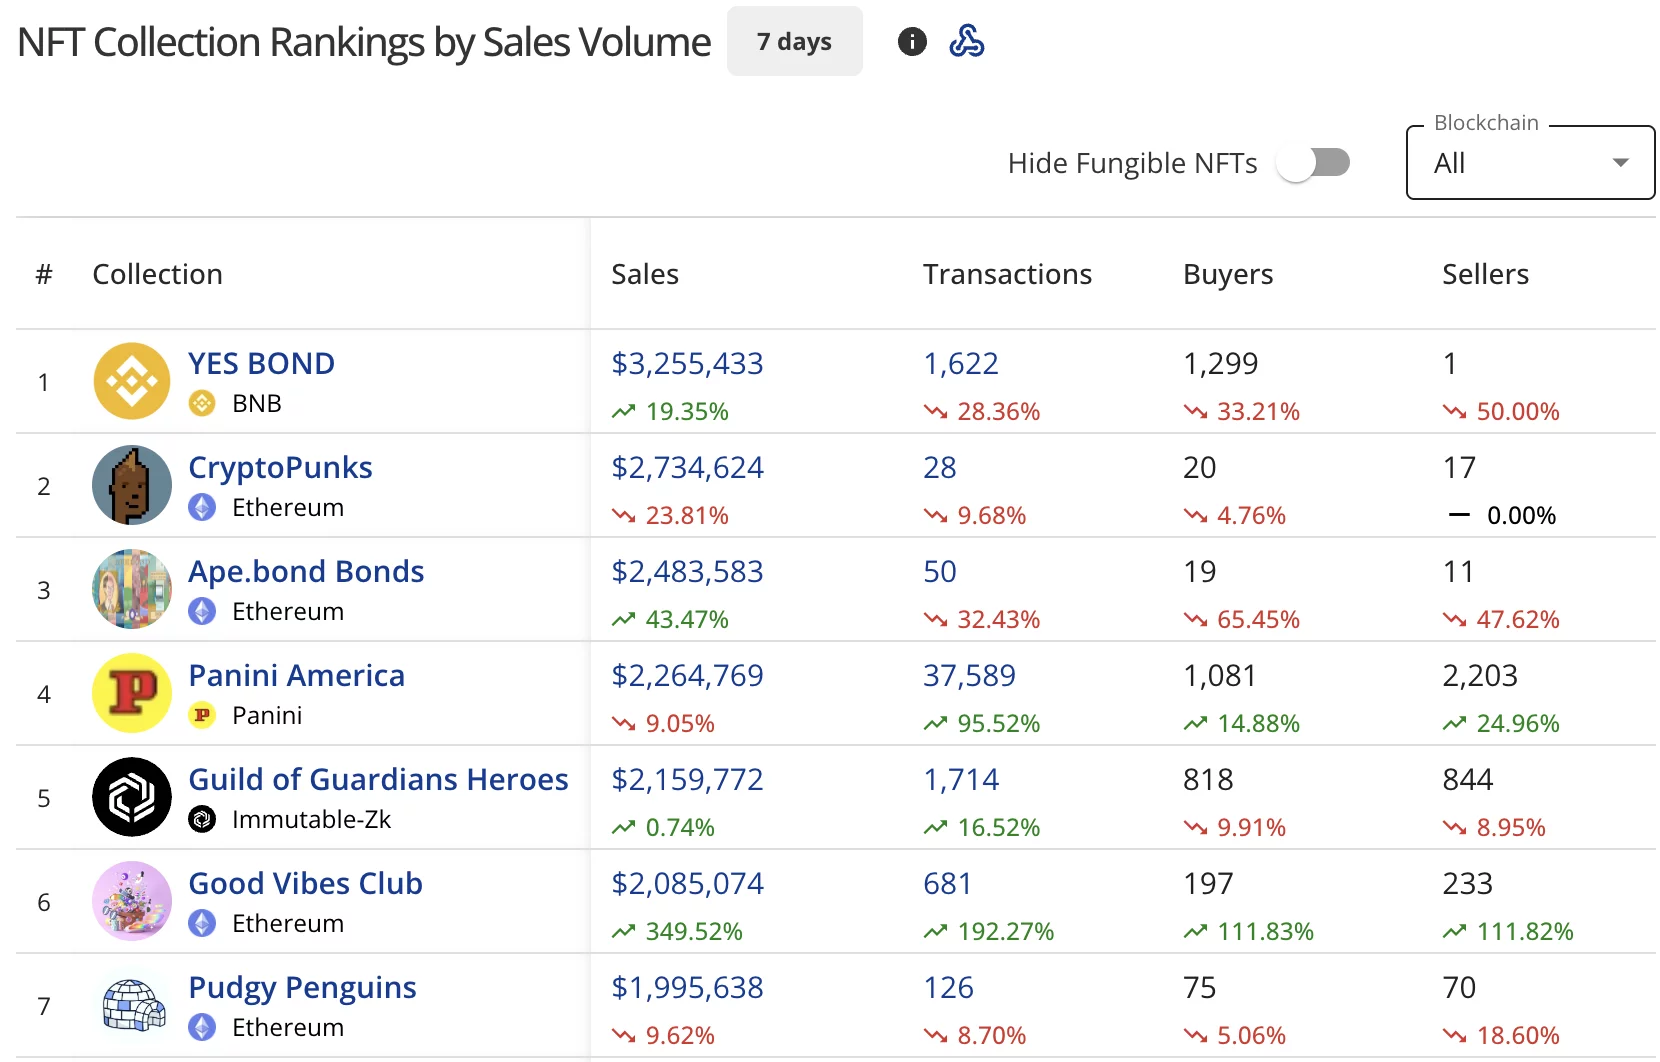
Panini America generated $2.26 million in sales with a 9.05% decline, while Guild of Guardians Heroes posted $2.16 million in sales, up 0.74%.

Good Vibes Club on Ethereum recorded $2.09 million in sales with a 349.52% gain. Pudgy Penguins rounded out the top seven with $2 million in sales, down 9.62%.

High-value sales led by Bitcoin NFTs

The week’s highest-value sales were dominated by $X@AI BRC-20 NFTs on Bitcoin. The top sale reached $1.10 million (12.0247 BTC), followed by another $X@AI piece at $898,131 (9.8453 BTC). Both transactions occurred three days ago.

CryptoPunks claimed three spots in the top five individual sales.

  • CryptoPunks #5705 sold for $163,672 (53 ETH) six days ago.
  • CryptoPunks #3043 fetched $123,926 (40 ETH)
  • CryptoPunks #4773 brought in $111,223 (35.9 ETH), both selling three days ago.
Market Opportunity
AINFT Logo
AINFT Price(NFT)
$0.000000344
$0.000000344$0.000000344
-0.46%
USD
AINFT (NFT) Live Price Chart
Disclaimer: The articles reposted on this site are sourced from public platforms and are provided for informational purposes only. They do not necessarily reflect the views of MEXC. All rights remain with the original authors. If you believe any content infringes on third-party rights, please contact service@support.mexc.com for removal. MEXC makes no guarantees regarding the accuracy, completeness, or timeliness of the content and is not responsible for any actions taken based on the information provided. The content does not constitute financial, legal, or other professional advice, nor should it be considered a recommendation or endorsement by MEXC.
Tags:

You May Also Like

Microsoft Corp. $MSFT blue box area offers a buying opportunity

Microsoft Corp. $MSFT blue box area offers a buying opportunity

The post Microsoft Corp. $MSFT blue box area offers a buying opportunity appeared on BitcoinEthereumNews.com. In today’s article, we’ll examine the recent performance of Microsoft Corp. ($MSFT) through the lens of Elliott Wave Theory. We’ll review how the rally from the April 07, 2025 low unfolded as a 5-wave impulse followed by a 3-swing correction (ABC) and discuss our forecast for the next move. Let’s dive into the structure and expectations for this stock. Five wave impulse structure + ABC + WXY correction $MSFT 8H Elliott Wave chart 9.04.2025 In the 8-hour Elliott Wave count from Sep 04, 2025, we saw that $MSFT completed a 5-wave impulsive cycle at red III. As expected, this initial wave prompted a pullback. We anticipated this pullback to unfold in 3 swings and find buyers in the equal legs area between $497.02 and $471.06 This setup aligns with a typical Elliott Wave correction pattern (ABC), in which the market pauses briefly before resuming its primary trend. $MSFT 8H Elliott Wave chart 7.14.2025 The update, 10 days later, shows the stock finding support from the equal legs area as predicted allowing traders to get risk free. The stock is expected to bounce towards 525 – 532 before deciding if the bounce is a connector or the next leg higher. A break into new ATHs will confirm the latter and can see it trade higher towards 570 – 593 area. Until then, traders should get risk free and protect their capital in case of a WXY double correction. Conclusion In conclusion, our Elliott Wave analysis of Microsoft Corp. ($MSFT) suggested that it remains supported against April 07, 2025 lows and bounce from the blue box area. In the meantime, keep an eye out for any corrective pullbacks that may offer entry opportunities. By applying Elliott Wave Theory, traders can better anticipate the structure of upcoming moves and enhance risk management in volatile markets. Source: https://www.fxstreet.com/news/microsoft-corp-msft-blue-box-area-offers-a-buying-opportunity-202509171323
Share
BitcoinEthereumNews2025/09/18 03:50
XRP Buyers Defend Most Major 200-Week Price Average: Can It Be Bottom of 2026?

XRP Buyers Defend Most Major 200-Week Price Average: Can It Be Bottom of 2026?

The post XRP Buyers Defend Most Major 200-Week Price Average: Can It Be Bottom of 2026? appeared on BitcoinEthereumNews.com. XRP has returned to its 200-week moving
Share
BitcoinEthereumNews2026/02/08 19:49
Expert Tags Ethereum’s ERC-8004 Mainnet Launch An “iPhone Moment”, Here’s What It Means

Expert Tags Ethereum’s ERC-8004 Mainnet Launch An “iPhone Moment”, Here’s What It Means

Market analyst says Ethereum is having an “iPhone moment” as it approaches the ERC-8004 mainnet launch.
Share
Coinstats2026/02/08 19:56