

Ondo Price Extends Losses to $0.41 Despite the Upcoming Solana Integration in Early 2026

Highlights:
- Ondo price extends losses to $0.41, marking an 8% plunge, as the bearish grip tightens.
- The Ondo Finance has revealed the plans to integrate with Solana in 2026, to expand its tokenized stocks and ETFs.
- The ONDO technical outlook remains bearish as its open interest plunges by 5%.
Ondo (ONDO) price is still correcting, currently exchanging hands at $0.41, marking an 8% decrease over the past 24 hours. On Monday, Ondo Finance said that it will integrate with Solana (SOL) in early 2026 to add to its tokenized stocks and Exchange Traded Funds (ETFs) platform. This recent announcement highlights a long-term bullish outlook. But the movements in the short run and derivatives indicate further downtrend, which is backed by the diminishing momentum and the declining belief of the traders.
The integration indicates a positive future for the native token of Ondo. This is because the integration leads to increased scalability, liquidity, and access to the rapidly expanding user base of SOL, expanding the ecosystem of Ondo and its adoption.
Meanwhile, the Coinglass derivatives market shows a drop in open interest, indicating a plunge in retail demand. The open interest has slid by 5.10% to $113.55 million. However, the long liquidations of $866,020 in the past 24 hours exceed the short liquidations as they sit at $14850, which means that there is a dominance on the sell side.
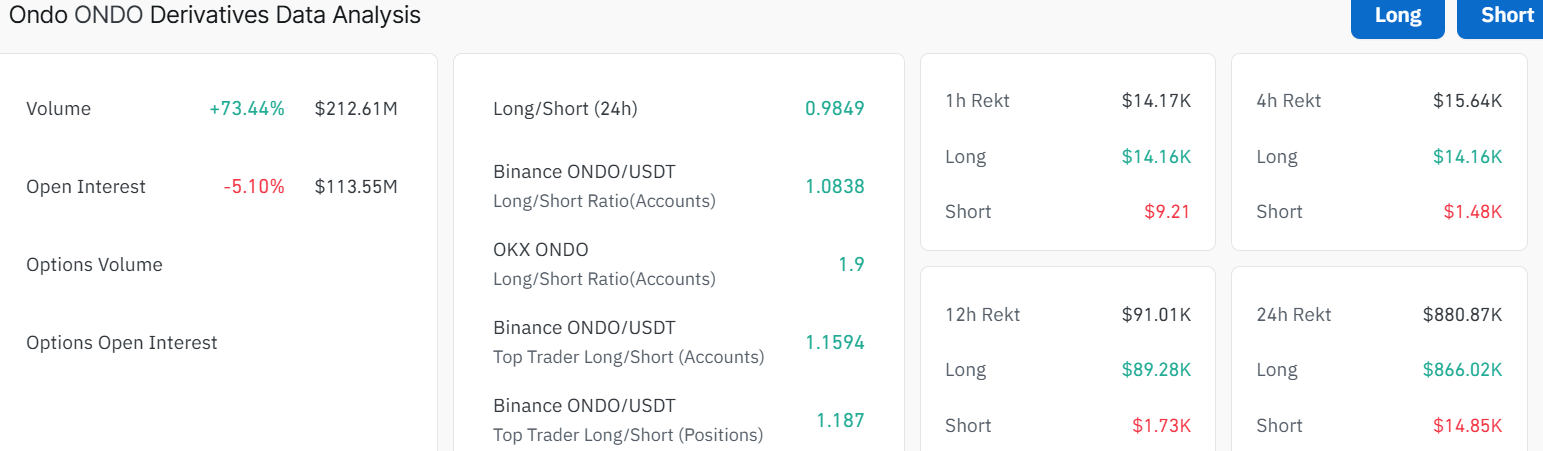 Ondo Derivatives Data: CoinGlass
Notably, the long-to-short ratio sits below one at 0.9873, indicating that the bears are still having the upper hand in the Ondo market.
Ondo Extends Losses as Bearish Grip Tightens
The ONDO/USD chart shows the token on a 1-day timeframe. Right now, it is hovering around $0.41, with a recent dip of 8% in the last 24 hours. The 50 Simple Moving Average (SMA) sits at $0.55, while the 200-day SMA is at $0.80, which indicates ONDO is riding a long-term bearish trend.
Notably, trouble is brewing as the Relative Strength Index (RSI) is plummeting and currently sits at 32.21, near the oversold territory. The chart also shows a descending parallel channel setup from which the price aims to break out if the bulls regain momentum.
Although the green 50-SMA is sloping down, the blue 200-day SMA is lagging, signaling a potential disconnect if momentum fades. Ondo’s volume is currently up 80% in the last day, which could mean renewed interest among traders.
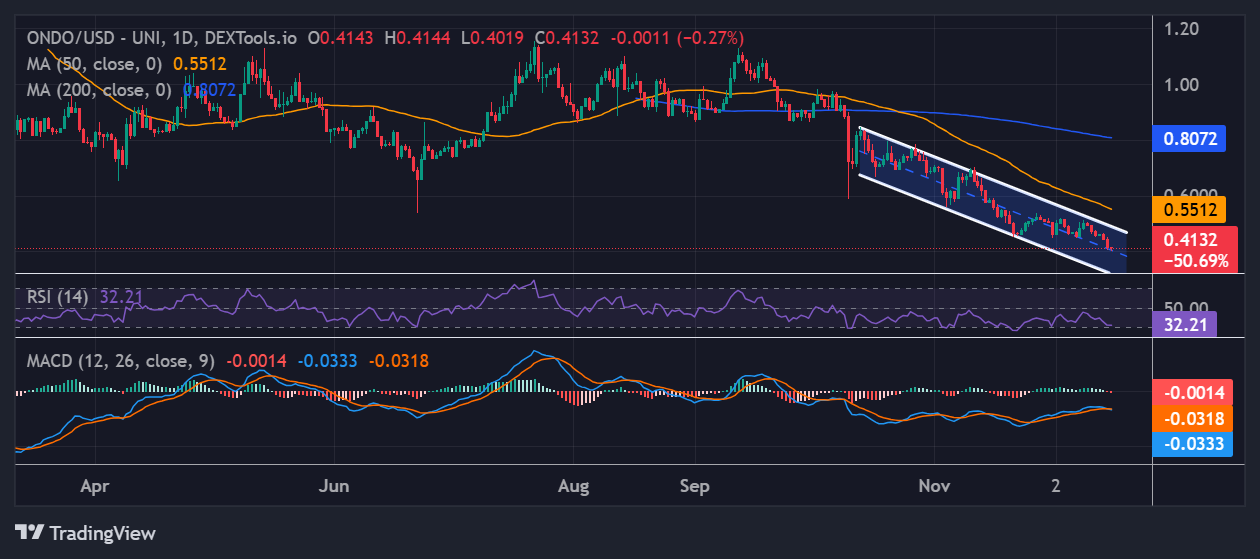 ONDO/USD 1-day chart: TradingView
The MACD’s blue line dipping below the signal line is a red flag, showing momentum is shifting, and fast. If ONDO bursts below the current levels, the next stop could be $0.40. A worst-case scenario would be a crash toward $0.39 if panic sets in.
On the flip side, if bulls step in and push past $0.52, ONDO might dodge the bullet and aim for $0.55 resistance zone, aligning with the 50-day SMA. Meanwhile, the 8% drop is not a lock, but the chart is showing warning signs. Traders should keep an eye on that parallel channel breakout retest and RSI to monitor the next move in ONDO.
eToro Platform
Best Crypto Exchange
- Over 90 top cryptos to trade
- Regulated by top-tier entities
- User-friendly trading app
- 30+ million users
eToro is a multi-asset investment platform. The value of your investments may go up or down. Your capital is at risk. Don’t invest unless you’re prepared to lose all the money you invest. This is a high-risk investment, and you should not expect to be protected if something goes wrong.
You May Also Like

Scylos Raises $3M Oversubscribed Seed Round to Advance Stateless Endpoint Infrastructure

Shutdown Jobs Data Finally Released, and It’s Not Pretty
