The post Chainlink Price Jumps 18% on First LINK ETF Launch, Targets $47 appeared first on Coinpedia Fintech News Chainlink (LINK) Price surged 18%, trading near $14.38. The uptrend came right after the launch of the first U.S. Chainlink ETF. Crypto analysts are also noticing early breakout signs on the chart and believe LINK could be gearing up for a strong rally toward $47. Grayscale Launches First US LINK ETF  On December 2, Grayscale …The post Chainlink Price Jumps 18% on First LINK ETF Launch, Targets $47 appeared first on Coinpedia Fintech News Chainlink (LINK) Price surged 18%, trading near $14.38. The uptrend came right after the launch of the first U.S. Chainlink ETF. Crypto analysts are also noticing early breakout signs on the chart and believe LINK could be gearing up for a strong rally toward $47. Grayscale Launches First US LINK ETF  On December 2, Grayscale …

Chainlink Price Jumps 18% on First LINK ETF Launch, Targets $47

2 min read
Chainlink Price

The post Chainlink Price Jumps 18% on First LINK ETF Launch, Targets $47 appeared first on Coinpedia Fintech News

Chainlink (LINK) Price surged 18%, trading near $14.38. The uptrend came right after the launch of the first U.S. Chainlink ETF.

Crypto analysts are also noticing early breakout signs on the chart and believe LINK could be gearing up for a strong rally toward $47.

On December 2, Grayscale launched the first U.S. ETF fully focused on Chainlink under the ticker GLNK. The ETF began trading on NYSE Arca with 0% fees at launch, making it easier for investors to get regulated exposure to LINK.

Meanwhile, data from SoSoValue shows strong demand on launch day, as trading volume surged to $13.81 million, while early inflows reached nearly $43 million

With Coinbase as custodian and access on platforms like Fidelity and Robinhood, Chainlink is getting more attention from big investors. 

Chainlink’s role in powering real-world data, smart contracts, and cross-chain tools makes it easier for traditional investors to see its value, boosting overall market sentiment.

While the ETF is boosting interest, the chainlink chart is telling its own bullish story. Crypto analysts altcoin pioneer, highlight a 4-year descending wedge, a pattern known for strong breakouts after long compression. 

Link token price recently bounced from the key $12.50 support level, indicating that buyers are active.

Link price chart

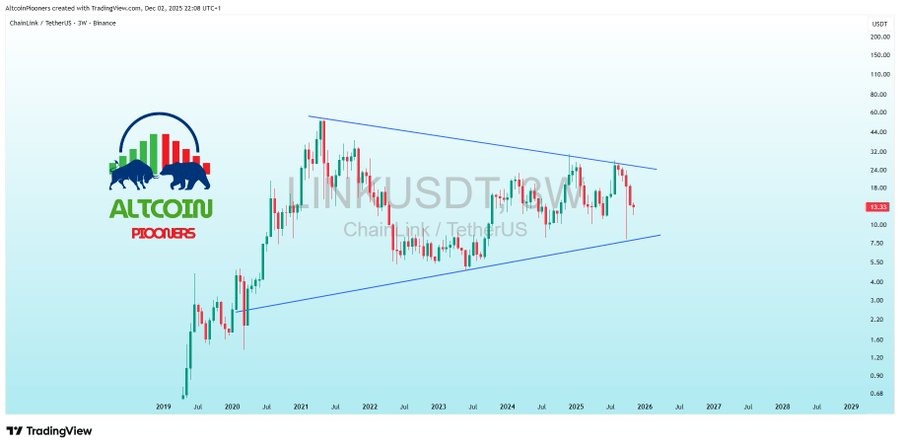
Momentum indicators are also improving, with the RSI showing a bullish divergence and sitting near the neutral 53 level, signaling growing strength. 

With these signals lining up, LINK is now positioned for a potential move toward the $18–$20 resistance zone, a key area that has rejected several attempts in the past.

Adding to the bullish outlook, well-known crypto analyst Ali Martinez says Chainlink has reached a crucial long-term support trendline. He believes this level could act as a launchpad for a strong move toward $26 and possibly even $47 before the year ends. 

With institutional inflows rising, a new ETF giving traditional investors easier access, and technical signals aligning for the first time in years, Chainlink is heading into December with powerful momentum behind it.

Market Opportunity
Chainlink Logo
Chainlink Price(LINK)
$9,2
$9,2$9,2
-0,21%
USD
Chainlink (LINK) Live Price Chart
Disclaimer: The articles reposted on this site are sourced from public platforms and are provided for informational purposes only. They do not necessarily reflect the views of MEXC. All rights remain with the original authors. If you believe any content infringes on third-party rights, please contact service@support.mexc.com for removal. MEXC makes no guarantees regarding the accuracy, completeness, or timeliness of the content and is not responsible for any actions taken based on the information provided. The content does not constitute financial, legal, or other professional advice, nor should it be considered a recommendation or endorsement by MEXC.

You May Also Like

Securities Fraud Investigation Into Corcept Therapeutics Incorporated (CORT) Announced – Shareholders Who Lost Money Urged To Contact Glancy Prongay Wolke & Rotter LLP, a Leading Securities Fraud Law Firm

Securities Fraud Investigation Into Corcept Therapeutics Incorporated (CORT) Announced – Shareholders Who Lost Money Urged To Contact Glancy Prongay Wolke & Rotter LLP, a Leading Securities Fraud Law Firm

LOS ANGELES–(BUSINESS WIRE)–Glancy Prongay Wolke & Rotter LLP, a leading national shareholder rights law firm, today announced that it has commenced an investigation
Share
AI Journal2026/02/05 04:00
Microsoft Corp. $MSFT blue box area offers a buying opportunity

Microsoft Corp. $MSFT blue box area offers a buying opportunity

The post Microsoft Corp. $MSFT blue box area offers a buying opportunity appeared on BitcoinEthereumNews.com. In today’s article, we’ll examine the recent performance of Microsoft Corp. ($MSFT) through the lens of Elliott Wave Theory. We’ll review how the rally from the April 07, 2025 low unfolded as a 5-wave impulse followed by a 3-swing correction (ABC) and discuss our forecast for the next move. Let’s dive into the structure and expectations for this stock. Five wave impulse structure + ABC + WXY correction $MSFT 8H Elliott Wave chart 9.04.2025 In the 8-hour Elliott Wave count from Sep 04, 2025, we saw that $MSFT completed a 5-wave impulsive cycle at red III. As expected, this initial wave prompted a pullback. We anticipated this pullback to unfold in 3 swings and find buyers in the equal legs area between $497.02 and $471.06 This setup aligns with a typical Elliott Wave correction pattern (ABC), in which the market pauses briefly before resuming its primary trend. $MSFT 8H Elliott Wave chart 7.14.2025 The update, 10 days later, shows the stock finding support from the equal legs area as predicted allowing traders to get risk free. The stock is expected to bounce towards 525 – 532 before deciding if the bounce is a connector or the next leg higher. A break into new ATHs will confirm the latter and can see it trade higher towards 570 – 593 area. Until then, traders should get risk free and protect their capital in case of a WXY double correction. Conclusion In conclusion, our Elliott Wave analysis of Microsoft Corp. ($MSFT) suggested that it remains supported against April 07, 2025 lows and bounce from the blue box area. In the meantime, keep an eye out for any corrective pullbacks that may offer entry opportunities. By applying Elliott Wave Theory, traders can better anticipate the structure of upcoming moves and enhance risk management in volatile markets. Source: https://www.fxstreet.com/news/microsoft-corp-msft-blue-box-area-offers-a-buying-opportunity-202509171323
Share
BitcoinEthereumNews2025/09/18 03:50
Over 80% of 135 Ethereum L2s record below 1 user operation per second

Over 80% of 135 Ethereum L2s record below 1 user operation per second

The post Over 80% of 135 Ethereum L2s record below 1 user operation per second  appeared on BitcoinEthereumNews.com. Ethereum’s L2s are not doing too well. Data
Share
BitcoinEthereumNews2026/02/05 03:52