

Berachain (BERA) Price Prediction 2025, 2026-2030
- Bullish BERA price prediction for 2025 is $2.963 to $4.823.
- Berachain (BERA) price might reach $10 soon.
- Bearish BERA price prediction for 2025 is $1.004.
In this Berachain (BERA) price prediction 2025, 2026-2030, we will analyze the price patterns of BERA by using accurate trader-friendly technical analysis indicators and predict the future movement of the cryptocurrency.
|
TABLE OF CONTENTS
|
|
INTRODUCTION
|
|
|
BERACHAIN (BERA) PRICE PREDICTION 2025
|
|
| BERACHAIN (BERA) PRICE PREDICTION 2026, 2027-2030 |
| CONCLUSION |
| FAQ |
Berachain (BERA) Current Market Status
| Current Price | $1.03 |
| 24 – Hour Price Change | 0.3% Up |
| 24 – Hour Trading Volume | $28.13M |
| Market Cap | $138.43M |
| Circulating Supply | 133.72M BERA |
| All – Time High | $14.99 (On Feb 06, 2025) |
| All – Time Low |
What is Berachain (BERA)
| TICKER | BERA |
| BLOCKCHAIN | Berachain (Layer-1) |
| CATEGORY | Utility Token |
| ORIGIN DATE | February 2025 |
| UTILITIES | Governance, staking, liquidity incentives, and transaction fees. |
Berachain is an innovative blockchain network that operates on a tri-token model and uses the Proof-of-Liquidity (PoL) consensus mechanism. This model ensures a balanced ecosystem by incentivizing users to provide liquidity while still enabling them to participate in DeFi applications. The platform is EVM-compatible, allowing developers to easily migrate and build decentralized applications (dApps) on it.
Berachain officially launched its mainnet on February 5, 2025, alongside its Token Generation Event (TGE), marking a major step for the project. The pre-launch phase saw Berachain’s vaults attracting over $3.3 billion in deposits, showcasing strong early adoption. The blockchain, built on the Cosmos SDK, features a tri-token system: BERA (used for transactions and fees), BGT (a governance token for liquidity providers), and HONEY (a stablecoin for collateral-backed transactions).
Shortly after the mainnet release, BERA tokens were made available for trading on major platforms like Binance, Bybit, MEXC, and KuCoin. Additionally, Binance launched its HODLer Airdrops program, offering rewards to users who staked BNB. BERA also follows an inflationary model, increasing its supply by 10% annually, designed to encourage sustainable growth over time.
Berachain (BERA) 24H Technicals
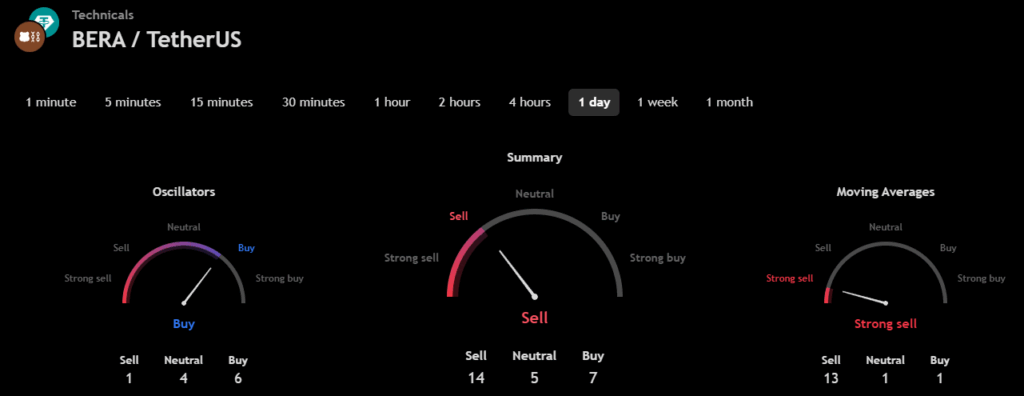 (Source: TradingView)
Berachain (BERA) Price Prediction 2025
Berachain (BERA) ranks 200th on CoinMarketCap in terms of its market capitalization. The overview of the Berachain price prediction for 2025 is explained below with a daily time frame.
BERA/USDT Horizontal Channel Pattern (Source: TradingView)
In the above chart, Berachain (BERA) laid out a horizontal channel pattern. The Horizontal channel pattern is also known as the sideways trend. In general, the horizontal channel is formed during the price consolidation. In this pattern, the upper trendline, the line that connects the highs, and the lower trendline, the line that connects the lows, run horizontally parallel, and the price action is contained within it.
A horizontal channel is often regarded as one of the suitable patterns for timing the market, as the buying and selling points are in consolidation.
At the time of analysis, Berachain (BERA) ‘s price was $1.03. If the pattern trend continues, then the price of BERA might reach the resistance levels of $2.978 and $5.653. If the trend reverses, then the price of BERA may fall to the support of $2.199 and $1.633.
Berachain (BERA) Resistance and Support Levels
The chart given below elucidates the possible resistance and support levels of Berachain (BERA) in 2025.
BERA/USDT Resistance and Support Levels (Source: TradingView)
From the above chart, we can analyze and identify the following as resistance and support levels of Berachain (BERA) for 2025.
| Resistance Level 1 | $2.963 |
| Resistance Level 2 | $4.823 |
| Support Level 1 | $1.722 |
| Support Level 2 | $1.004 |
BERA Resistance & Support Levels
Berachain (BERA) Price Prediction 2025 — RVOL, MA, and RSI
The technical analysis indicators such as Relative Volume (RVOL), Moving Average (MA), and Relative Strength Index (RSI) of Berachain (BERA) are shown in the chart below.
BERA/USDT RVOL, MA, RSI (Source: TradingView)
From the readings on the chart above, we can make the following inferences regarding the current Berachain (BERA) market in 2025.
| INDICATOR | PURPOSE | READING | INFERENCE |
| 50-Day Moving Average (50MA) | Nature of the current trend by comparing the average price over 50 days | 50 MA =$2.171Price = $2.640 (50MA < Price) | Bullish/Uptrend |
| Relative Strength Index (RSI) | Magnitude of price change;Analyzing oversold & overbought conditions | 60.710 <30 = Oversold50-70 = Neutral>70 = Overbought | Neutral |
| Relative Volume (RVOL) | Asset’s trading volume in relation to its recent average volumes | Below cutoff line | Weak volume |
Berachain (BERA) Price Prediction 2025 — ADX, RVI
In the below chart, we analyze the strength and volatility of Berachain (BERA) using the following technical analysis indicators — Average Directional Index (ADX) and Relative Volatility Index (RVI).
BERA/USDT ADX, RVI (Source: TradingView)
From the readings on the chart above, we can make the following inferences regarding the price momentum of Berachain (BERA).
| INDICATOR | PURPOSE | READING | INFERENCE |
| Average Directional Index (ADX) | Strength of the trend momentum | 28.864 | Strong Trend |
| Relative Volatility Index (RVI) | Volatility over a specific period | 63.10 <50 = Low >50 = High | High Volatility |
Comparison of BERA with BTC, ETH
Let us now compare the price movements of Berachain (BERA) with those of Bitcoin (BTC), and Ethereum (ETH).
BTC Vs ETH Vs BERA Price Comparison (Source: TradingView)
From the above chart, we can interpret that the price action of BERA is similar to that of BTC and ETH. That is, when the price of BTC and ETH increases or decreases, the price of BERA also increases or decreases, respectively.
Berachain (BERA) Price Prediction 2026, 2027 – 2030
With the help of the aforementioned technical analysis indicators and trend patterns, let us predict the price of Berachain (BERA) between 2026, 2027, 2028, 2029, and 2030.
| Year | Bullish Price | Bearish Price |
| Berachain (BERA) Price Prediction 2026 | $40 | $1 |
| Berachain (BERA) Price Prediction 2027 | $58 | $0.9 |
| Berachain (BERA) Price Prediction 2028 | $69 | $0.8 |
| Berachain (BERA) Price Prediction 2029 | $82 | $0.7 |
| Berachain (BERA) Price Prediction 2030 | $100 | $0.6 |
Conclusion
If Berachain (BERA) establishes itself as a good investment in 2025, this year would be favorable to the cryptocurrency. In conclusion, the bullish Berachain (BERA) price prediction for 2025 is $4.823. Comparatively, if unfavorable sentiment is triggered, the bearish Berachain (BERA) price prediction for 2025 is $1.004.
If the market momentum and investors’ sentiment positively elevates, then Berachain (BERA) might hit $10. Furthermore, with future upgrades and advancements in the Berachain ecosystem, BERA might surpass its current all-time high (ATH) of $14.99 and mark its new ATH.
FAQ
1. What is Berachain (BERA)?
Berachain (BERA) is a high-performance, EVM-compatible blockchain using a unique Proof-of-Liquidity consensus model.
2. Where can you purchase Berachain (BERA)?
Berachain (BERA) has been listed mostly on all crypto exchanges – from Binance, OKX, Bybit, Bitget, KuCoin and UpBit.
3. Will Berachain (BERA) reach a new ATH soon?
With the ongoing developments and upgrades within the Berachain platform, BERA has a high possibility of reaching its ATH soon.
4. What is the current all-time high (ATH) of Berachain (BERA)?
On February 06 2025, Berachain (BERA) reached its new all-time high (ATH) of $14.99.
5. What is the lowest price of Berachain (BERA)?
According to CoinMarketCap, BERA hit its all-time low (ATL) of $0.8738 on October 11, 2025.
6. Will Berachain (BERA) reach $10?
If the bullish trend continues and if Berachain (BERA) retests its resistance levels, it will hit $10 soon.
7. What will be the Berachain (BERA) price by 2026?
Berachain (BERA) price is expected to reach $15 by 2026.
8. What will be the Berachain (BERA) price by 2027?
Berachain (BERA) price is expected to reach $20 by 2027.
9. What will be the Berachain (BERA) price by 2028?
Berachain (BERA) price is expected to reach $25 by 2028.
10. What will be the Berachain (BERA) price by 2029?
Berachain (BERA) price is expected to reach $30 by 2029.
Top Crypto Predictions
Cronos (CRO) Price Prediction
Worldcoin (WLD) Price Prediction
Binance Coin (BNB) Price Prediction
Disclaimer: The opinion expressed in this article is solely the author’s. It does not represent any investment advice. TheNewsCrypto team encourages all to do their own research before investing.
You May Also Like

Microsoft Corp. $MSFT blue box area offers a buying opportunity

XRP Buyers Defend Most Major 200-Week Price Average: Can It Be Bottom of 2026?
