

Sui Price Prediction 2026, 2027-2030: Can SUI Become a Leading Smart Contract Platform?
The post Sui Price Prediction 2026, 2027-2030: Can SUI Become a Leading Smart Contract Platform? appeared first on Coinpedia Fintech News
Story Highlights
- The live price of SUI crypto is $ 1.89029369.
- SUI shows strong bullish momentum in early 2026, backed by rising TVL, ecosystem growth, and renewed investor confidence.
- If key resistance breaks, SUI could target $3–$5 in 2026, with long-term potential extending toward $15–$18 by 2030.
SUI price prediction suggests a bullish stance in the upcoming months due to the positive start of 2026. Within a week, the SUI price surged more than 30%, grabbing traders and long-term investors.
As the price trend turns bullish and market sentiment flips positive, investors and traders are intrigued by its next stop.
The previous year has been a great one for SUI with increased confidence across the crypto market. The project benefited from continued ecosystem growth, more developers building on top of the network, and interest from funds and long-term investors.
Even though the broader market had to contend with issues such as global uncertainty and sudden pullbacks, SUI managed to hold its position, which helped to build trust in the future of the token.
What’s standing out now is how SUI is gradually gaining a reputation as a fast and scalable Layer-1 that can handle real-world use-cases. As more teams, partners, and early backers continue to rely on the ecosystem, confidence around SUI’s long-term potential continues to grow stronger.
With recent price strength and the increase in attention, investors are beginning to ask the big questions: Can SUI continue this momentum? Can it become one of the top smart contract platforms in the next few years?
This SUI price prediction for 2026-2030 takes an in-depth look at what’s moving the needle on the token and what could shape its journey going forward.
Sui Price Today
| Cryptocurrency | Sui |
| Token | SUI |
| Price | $1.8903 |
| Market Cap | $ 7,168,339,729.06 |
| 24h Volume | $ 1,540,877,865.3021 |
| Circulating Supply | 3,792,183,074.7739 |
| Total Supply | 10,000,000,000.00 |
| All-Time High | $ 5.3519 on 06 January 2025 |
| All-Time Low | $ 0.3643 on 19 October 2023 |
Table of contents
- SUI’s 2024-2025 Price Story: What the Weekly Charts Reveal
- SUI Price Prediction 2026
- SUI Price Onchain Outlook
- SUI Crypto Price Prediction 2026 – 2030
- SUI Price Forecast 2026
- SUI Price Prediction 2027
- SUI Prediction 2028
- SUI Price Prediction 2029
- SUI Price Prediction 2030
- SUI Price Prediction 2031, 2032, 2033, 2040, 2050
- SUI Price Prediction: Analysts and Influencers’ SUI Price Target
- CoinPedia’s Sui Price Prediction
- FAQs
SUI’s 2024-2025 Price Story: What the Weekly Charts Reveal
The SUI price action observed since late 2024 showed a steady bullish trend, forming higher highs on the weekly timeframe. The major swing low for SUI was formed during the broader market bottom, which was marked in mid-2024 near the $0.50-$0.53.
Following the bottom, SUI printed a sharp rally in the Q2 2024, supported by ecosystem growth and positive market sentiment. The rally gained momentum during Q3 2024 and into early 2025, resulting in hitting an All-Time-High (ATH) of $5.35 on 6 January 2025.
As the SUI price failed to sustain bullish momentum near the ATH trajectory, SUI entered into a distribution phase during Q1 2025 and faced a decline to the demand zone near $2. However, the mighty bulls have succeeded in absorbing the selling pressure, and a reversal rally was noted during the mid 2025, and the SUI price retested the supply zone around $4.50.
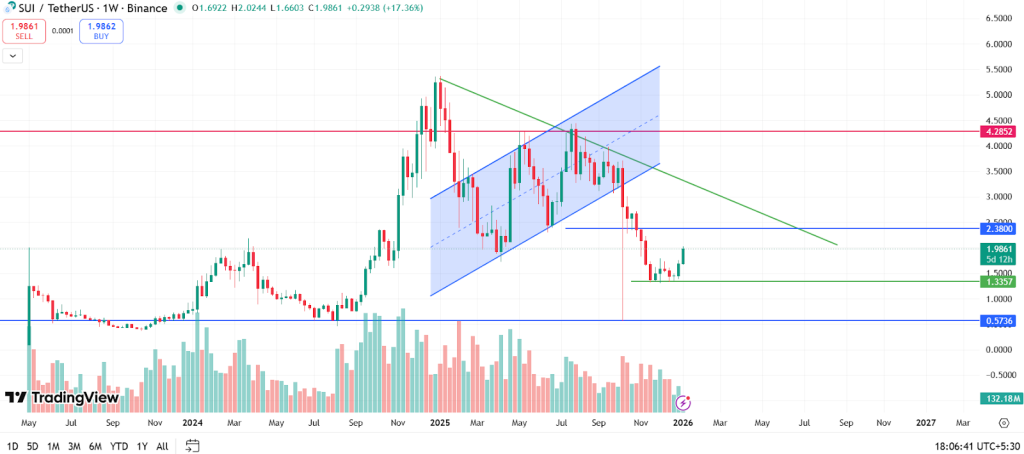
Subsequently, the bulls failed to violate the zone, and a rejection was noted, which resulted in a breakdown of the channel and a steep decline toward 2024’s low was witnessed.
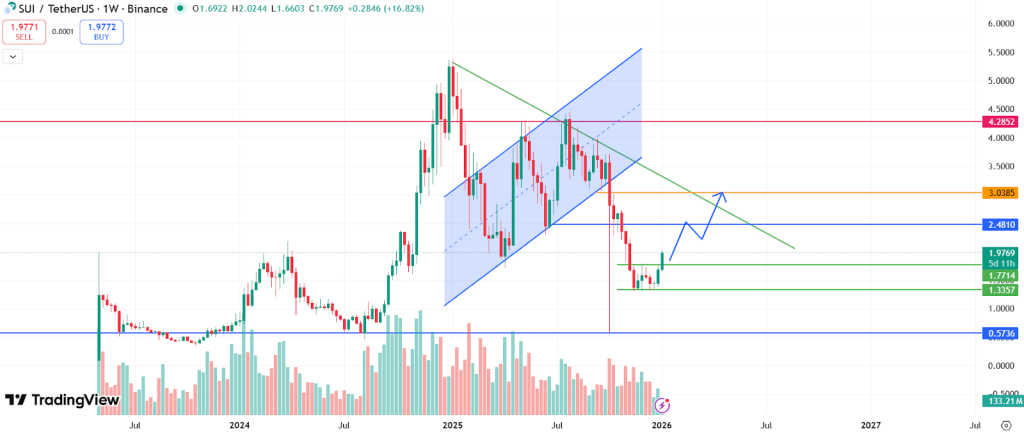
While the long term price structure remains positive, the beginning of 2026 showcases signs of bullish momentum which may push SUI price toward $3 in the upcoming months.
From a technical standpoint, the $2.20-$2.40 zone remains a critical resistance zone. A decisive close above it could open the doors toward the $3 zone.
The $1.30-$1.40 zone remains a crucial support zone. A break below this zone could trigger an aggressive decline toward $1 ahead.
SUI Price Prediction 2026
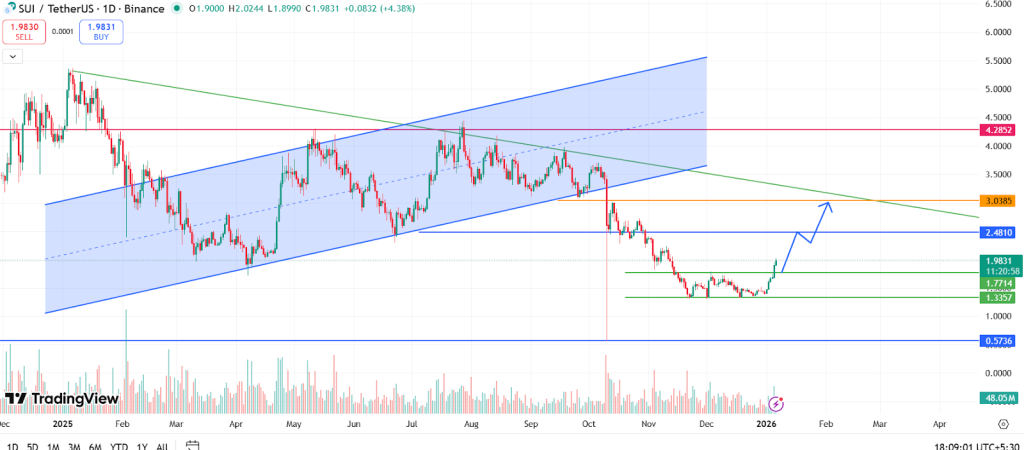
With the beginning of 2026, SUI price action showcased a bullish start and replicated a relief rally that may exceed $2.30-$3 in the near months.
As buyers have defended the key support zone of $1.30, the price action reflects a pullback and a reversal rally will be on the cards. A breakout above the $3 would be needed to trigger a sharp rally toward the ATH zone of $5.
Currently, the SUI price is hinting at a bounce from the support zone and forming a double bottom pattern around $1.30-$1.50.
In the last seven days, SUI price rallied more than 30% and showcased strong bullish momentum. If the bulls are indeed energized, they must surpass the November highs by early January 2026. Strengthening this short-term trajectory for the first quarter of 2026 could propel the price towards $2.40-$3.
SUI Price Onchain Outlook
SUI’s ecosystem fundamentals have remained strong. Per DeFiLlama, SUI’s Total Value Locked (TVL) has surpassed $1 billion, showing growing demand for DeFi protocols and meaningful capital deployment on the chain.
High TVL often correlates with improved investor confidence and deeper liquidity, which can underpin price stability and future upside if adoption expands.

SUI’s network activity reflects real usage. Strong DEX volume and steady transaction counts suggest active participation on the chain, not just speculative trading. High throughput and utility drive organic demand for the token as gas and staking incentive.
SUI Crypto Price Prediction 2026 – 2030
| Year | Potential Low ($) | Potential Average ($) | Potential High ($) |
| 2026 | $2 | $3 | $5 |
| 2027 | $4 | $6 | $8 |
| 2028 | $8 | $10 | $12 |
| 2029 | $10 | $13 | $16 |
| 2030 | $12 | $15 | $18 |
SUI Price Forecast 2026
The SUI price range in 2026 is expected to be between $2 and $5.
SUI Price Prediction 2027
Subsequently, the SUI price range can be between $4 to $8 during the year 2027.
SUI Prediction 2028
Beyond the previous ATH,SUI bullish momentum may gain pace and will see another bullish spark in 2028. Specifically, as per our SUI Price Prediction, the potential SUI price range in 2028 is $8 to $12.
SUI Price Prediction 2029
Thereafter, the SUI price for the year 2029 could range between $10 and $16
SUI Price Prediction 2030
Finally, in 2030, the price of SUI is predicted to maintain a steady positive. It may trade between $12 and $18.
SUI Price Prediction 2031, 2032, 2033, 2040, 2050
Based on the historic market sentiments and trend analysis of the largest cryptocurrency by market capitalization, here are the possible SUI price targets for the longer time frames.
| Year | Potential Low ($) | Potential Average ($) | Potential High ($) |
| 2031 | $8 | $10 | $15 |
| 2032 | $10 | $13 | $18 |
| 2033 | $12 | $15 | $22 |
| 2040 | $20 | $32 | $40 |
| 2050 | $30 | $70 | $150+ |
SUI Price Prediction: Analysts and Influencers’ SUI Price Target
- As per the CryptoBullet, the SUI price may reach $8+ by 2030.
- According to analyst “That Martini Guy,” the SUI price could reach $20 or more by 2030.
CoinPedia’s Sui Price Prediction
Coinpedia’s price prediction for SUI remains bullish, as the token has started the year on a strong note and may continue its upward rally. The price could further demonstrate bullish momentum by forming higher-high swings.
Based on the current price action, SUI is projected to reach $7, with a potential average trading range between $3.80 and $4.80.
Coinpedia expects the SUI price to touch $7 by the end of the year.
| Year | Potential Low ($) | Potential Average ($) | Potential High ($) |
| 2026 | $2 | $3.80 – $4.50 | $7 |
Never Miss a Beat in the Crypto World!
Stay ahead with breaking news, expert analysis, and real-time updates on the latest trends in Bitcoin, altcoins, DeFi, NFTs, and more.
FAQs
SUI is expected to trade between $2 and $5 in 2026, supported by bullish momentum, strong ecosystem growth, and rising investor confidence.
Yes, if SUI breaks above key resistance near $3 and market conditions stay favorable, a retest of its $5.35 ATH is possible.
SUI shows long-term potential due to its scalable Layer-1 design, growing DeFi adoption, and increasing developer and institutional interest.
Key drivers include rising TVL above $1B, strong on-chain activity, ecosystem expansion, and SUI’s reputation as a fast, scalable network.
By 2030, SUI could trade between $12 and $18, assuming continued adoption, network usage growth, and a supportive crypto market trend.
You May Also Like

Crucial US Stock Market Update: What Wednesday’s Mixed Close Reveals

Trump suggests he wants to send Americans 'that don't work' to other countries
