

AI for Risk Stratification: Multimodal DL Models Offer Enhanced Prognosis for Pulmonary Embolism
Table of Links
Abstract
- Introduction
- Methods
- Results
- Discussion
- Conclusions, Acknowledgments, and References
5. Conclusions
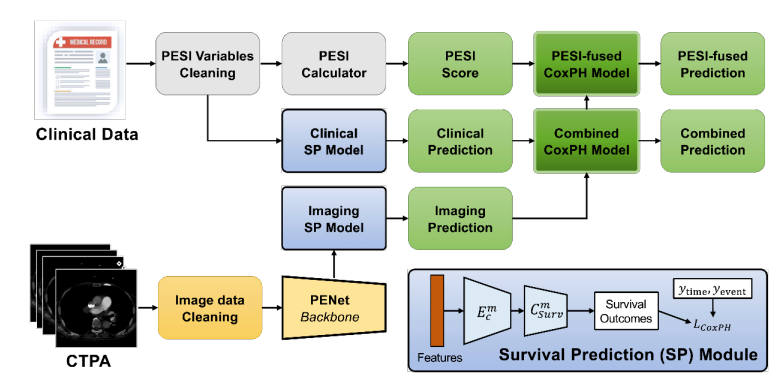
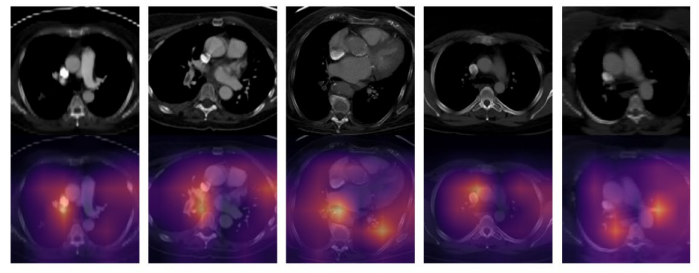
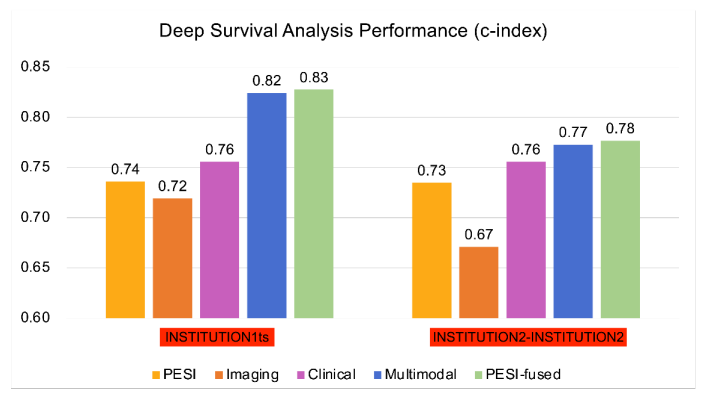
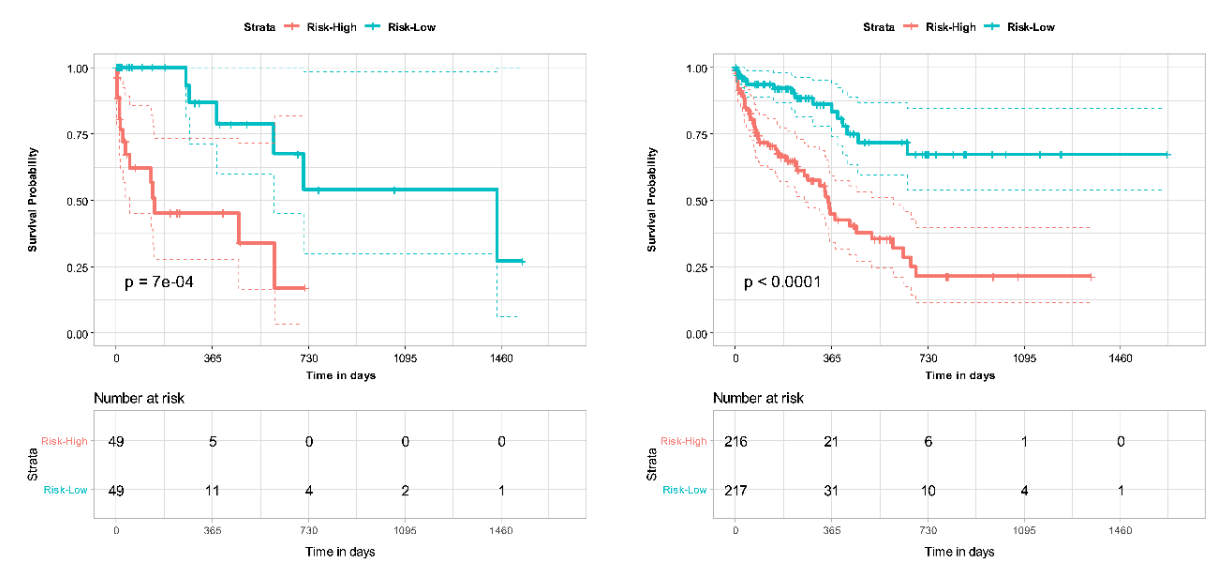
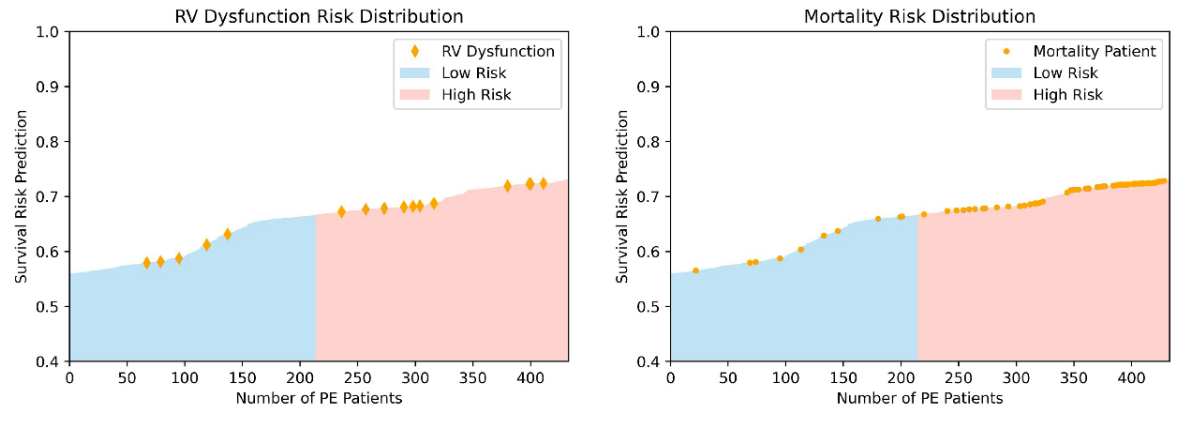
Multiomic DL models based on combined CTPA features and clinical variables demonstrated improved performance compared to PESI score alone for mortality prediction in PE. The addition of PESI to the multimodal model demonstrated only a marginal performance improvement, illustrating that AI-based models are sufficiently capable of survival prediction. The multimodal models similarly improved performance upon PESI alone in 30-day mortality risk estimation. Through NRI analysis, clinical and imaging data were both independently shown to contribute to improved performance of the multimodal model. These findings demonstrate the strength of a multimodal DL model in comparison to the current clinical standard of PESI, turning prognosis into an intelligent process that integrates greater clinical and imaging information. Additionally, we demonstrated concordance of our model with clinical indicators of mortality, such as RV dysfunction. Further analysis can shed more light on the connectedness of various risk factors with mortality in PE patients, and how this information can be leveraged for model development in survival prediction. However, the benefits of our model can only be confirmed by additional validation on larger and more diverse datasets, as well as prospective testing of the developed models.
\ Our study highlights the utility of DL-based models in prognostication and risk stratification in patients with PE. AI has the potential to improve the clinical workflow for radiologists and clinicians by providing rapid and accurate diagnostic and prognostic information. By offering timely yet accurate risk stratification for PE patients, AI may offer a substantial benefit to patients and providers by informing clinical decision-making, potentially improving patient outcomes.
Acknowledgments
None.
References
-
Beckman MG, Hooper WC, Critchley SE, Ortel TL. Venous thromboembolism: a public health concern. American journal of preventive medicine. 2010;38(4):S495-S501.
\
-
Lewis AE, Gerstein NS, Venkataramani R, Ramakrishna H. Evolving management trends and outcomes in catheter management of acute pulmonary embolism. Journal of Cardiothoracic and Vascular Anesthesia. 2022;36(8):3344-3356.
\
-
Goldhaber SZ, Bounameaux H. Pulmonary embolism and deep vein thrombosis. The Lancet. 2012;379(9828):1835-1846.
\
-
Piazza G, Goldhaber SZ. Acute pulmonary embolism: part I: epidemiology and diagnosis. Circulation. 2006;114(2):e28-e32.
\
-
Aujesky D, Obrosky DS, Stone RA, et al. Derivation and validation of a prognostic model for pulmonary embolism. American journal of respiratory and critical care medicine. 2005;172(8):1041-1046.
\
-
Donzé J, Le Gal G, Fine MJ, et al. Prospective validation of the pulmonary embolism severity index. Thrombosis and haemostasis. 2008;100(05):943-948.
\
-
Ishwaran H, Kogalur UB, Blackstone EH, Lauer MS. Random survival forests. 2008;
\
-
Fox J, Weisberg S. Cox proportional-hazards regression for survival data. An R and S-PLUS companion to applied regression. 2002;2002
\
-
Katzman JL, Shaham U, Cloninger A, Bates J, Jiang T, Kluger Y. DeepSurv: personalized treatment recommender system using a Cox proportional hazards deep neural network. BMC medical research methodology. 2018;18(1):1-12.
\
-
Oren O, Gersh BJ, Bhatt DL. Artificial intelligence in medical imaging: switching from radiographic pathological data to clinically meaningful endpoints. The Lancet Digital Health. 2020;2(9):e486-e488.
\
-
Weikert T, Winkel DJ, Bremerich J, et al. Automated detection of pulmonary embolism in CT pulmonary angiograms using an AI-powered algorithm. European radiology. 2020;30:6545-6553.
\
-
Huang S-C, Kothari T, Banerjee I, et al. PENet—a scalable deep-learning model for automated diagnosis of pulmonary embolism using volumetric CT imaging. NPJ digital medicine. 2020;3(1):61.
\
-
Huang S-C, Pareek A, Zamanian R, Banerjee I, Lungren MP. Multimodal fusion with deep neural networks for leveraging CT imaging and electronic health record: a case-study in pulmonary embolism detection. Scientific reports. 2020;10(1):22147.
\
-
Liu W, Liu M, Guo X, et al. Evaluation of acute pulmonary embolism and clot burden on CTPA with deep learning. European radiology. 2020;30:3567-3575.
\
-
Yao J, Zhu X, Zhu F, Huang J. Deep correlational learning for survival prediction from multi-modality data. Springer; 2017:406-414.
\
-
Vale-Silva LA, Rohr K. Long-term cancer survival prediction using multimodal deep learning. Scientific Reports. 2021;11(1):13505.
\
-
Meyer G, Vicaut E, Danays T, et al. Fibrinolysis for patients with intermediate-risk pulmonary embolism. New England Journal of Medicine. 2014;370(15):1402-1411.
\
-
Hofmanninger J, Prayer F, Pan J, Röhrich S, Prosch H, Langs G. Automatic lung segmentation in routine imaging is primarily a data diversity problem, not a methodology problem. European Radiology Experimental. 2020;4(1):1-13.
\
-
Harrell Jr FE, Lee KL, Califf RM, Pryor DB, Rosati RA. Regression modelling strategies for improved prognostic prediction. Statistics in medicine. 1984;3(2):143-152.
\
-
Leening MJ, Vedder MM, Witteman JC, Pencina MJ, Steyerberg EW. Net reclassification improvement: computation, interpretation, and controversies: a literature review and clinician's guide. Annals of internal medicine. 2014;160(2):122-131.
\
-
Kaplan EL, Meier P. Nonparametric estimation from incomplete observations. Journal of the American statistical association. 1958;53(282):457-481.
\
-
Grifoni S, Olivotto I, Cecchini P, et al. Short-term clinical outcome of patients with acute pulmonary embolism, normal blood pressure, and echocardiographic right ventricular dysfunction. Circulation. 2000;101(24):2817-2822.
\
-
Coutance G, Cauderlier E, Ehtisham J, Hamon M, Hamon M. The prognostic value of markers of right ventricular dysfunction in pulmonary embolism: a meta-analysis. Critical care. 2011;15:1-10.
\
-
Chaudhary K, Poirion OB, Lu L, Garmire LX. Deep learning–based multi-omics integration robustly predicts survival in liver cancer. Clinical Cancer Research. 2018;24(6):1248-1259.
\
-
Somani SS, Honarvar H, Narula S, et al. Development of a machine learning model using electrocardiogram signals to improve acute pulmonary embolism screening. European Heart Journal-Digital Health. 2022;3(1):56-66.
\
-
Tourassi GD, Floyd CE, Sostman HD, Coleman RE. Acute pulmonary embolism: artificial neural network approach for diagnosis. Radiology. 1993;189(2):555-558.
\
-
Soffer S, Klang E, Shimon O, et al. Deep learning for pulmonary embolism detection on computed tomography pulmonary angiogram: a systematic review and meta-analysis. Scientific reports. 2021;11(1):15814.
\
-
Elias A, Mallett S, Daoud-Elias M, Poggi J-N, Clarke M. Prognostic models in acute pulmonary embolism: a systematic review and meta-analysis. BMJ open. 2016;6(4):e010324.
\
-
Cahan N, Klang E, Marom EM, et al. Multimodal fusion models for pulmonary embolism mortality prediction. Scientific Reports. 2023;13(1):1-15.
Figure
\ 
\ 
\ 
\ 
\ 
\ 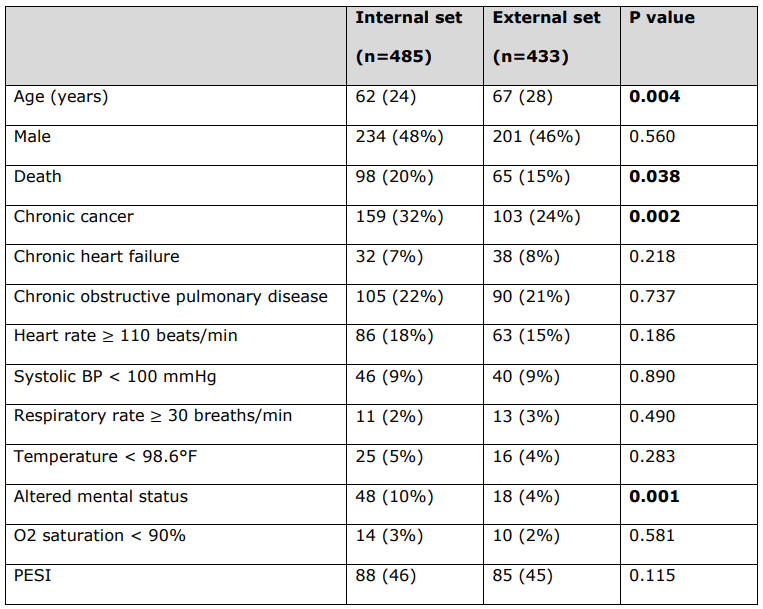
\ Detailed patient characteristics of PESI clinical variables used to calculate PESI score for each patient.
\ All continuous variables are reported as median (interquartile range), and all categorical variables are reported as number (%). Statistically significant p-values are bolded (p < 0.05). Deceased status is not a PESI clinical variable.
\ BP = Blood Pressure. PESI = Pulmonary Embolism Severity Index.
\ 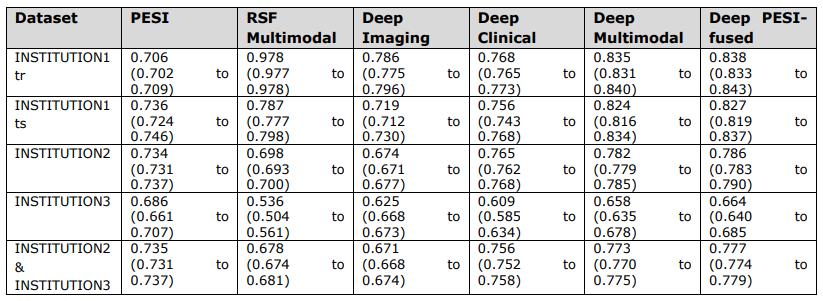
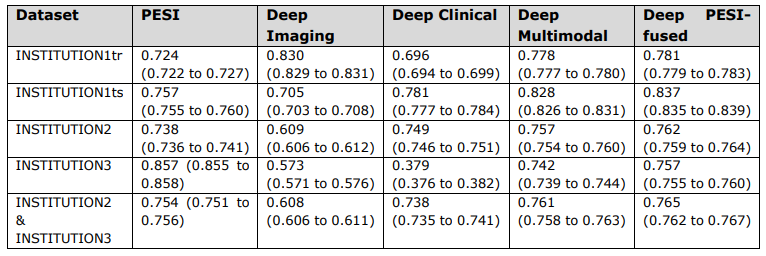
\ Overall c-index values and corresponding 95% confidence intervals of PESI and prediction models.
\ INSTITUTION3 = INSTITUTION3. PESI = Pulmonary Embolism Severity Index. RSF = Random Survival Forest. INSTITUTION1 = INSTITUTION1. INSTITUTION1tr = training set. INSTITUTION1ts = internal test set. INSTITUTION2 = INSTITUTION2. INSTITUTION2- INSTITUTION3 = external test set.
\ 
\ Short term (30-day) survival prediction performance as measured by c-index values and corresponding 95% confidence intervals of PESI and prediction models.
\ INSTITUTION3 = INSTITUTION3. PESI = Pulmonary Embolism Severity Index. INSTITUTION1 = INSTITUTION1. INSTITUTION1tr = training set. INSTITUTION1ts = internal test set. INSTITUTION2 = INSTITUTION2. INSTITUTION2- INSTITUTION3 = external test set.
\ 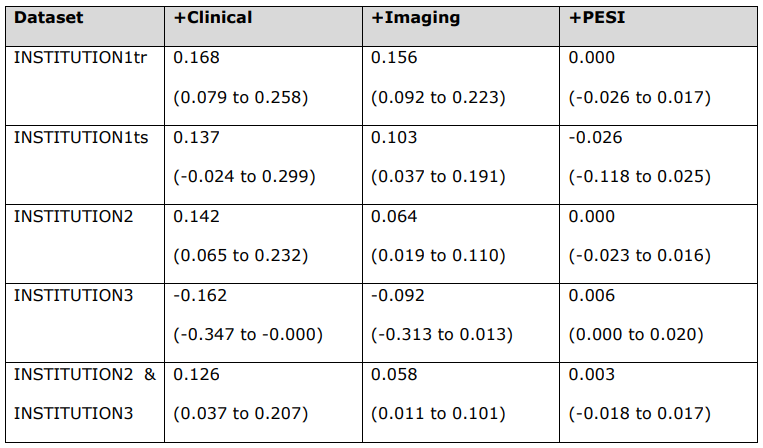
\ Risk scores were calculated between imaging and multimodal (+Clinical), clinical and multimodal (+Imaging), and multimodal and PESI-fused (+PESI) models for each dataset.
\ INSTITUTION3 = INSTITUTION3. PESI = Pulmonary Embolism Severity Index. INSTITUTION1 = INSTITUTION1. INSTITUTION1tr = training set. INSTITUTION1ts = internal test set. INSTITUTION2 = INSTITUTION2. INSTITUTION2- INSTITUTION3 = external test set.
\
:::info Authors:
(1) Zhusi Zhong, BS, a Co-first authors from Department of Diagnostic Radiology, Rhode Island Hospital, Providence, RI, 02903, USA, Warren Alpert Medical School of Brown University, Providence, RI, 02903, USA, and School of Electronic Engineering, Xidian University, Xi’an 710071, China;
(2) Helen Zhang, BS, a Co-first authors from Department of Diagnostic Radiology, Rhode Island Hospital, Providence, RI, 02903, USA and Warren Alpert Medical School of Brown University, Providence, RI, 02903, USA;
(3) Fayez H. Fayad, BA, a Co-first authors from Department of Diagnostic Radiology, Rhode Island Hospital, Providence, RI, 02903, USA and Warren Alpert Medical School of Brown University, Providence, RI, 02903, USA;
(4) Andrew C. Lancaster, BS, Department of Radiology and Radiological Sciences, Johns Hopkins University School of Medicine, Baltimore, MD, 21205, USA and Johns Hopkins University School of Medicine, Baltimore, MD, 21205, USA;
(5) John Sollee, BS, Department of Diagnostic Radiology, Rhode Island Hospital, Providence, RI, 02903, USA and Warren Alpert Medical School of Brown University, Providence, RI, 02903, USA;
(6) Shreyas Kulkarni, BS, Department of Diagnostic Radiology, Rhode Island Hospital, Providence, RI, 02903, USA and Warren Alpert Medical School of Brown University, Providence, RI, 02903, USA;
(7) Cheng Ting Lin, MD, Department of Radiology and Radiological Sciences, Johns Hopkins University School of Medicine, Baltimore, MD, 21205, USA;
(8) Jie Li, PhD, School of Electronic Engineering, Xidian University, Xi’an 710071, China;
(9) Xinbo Gao, PhD, School of Electronic Engineering, Xidian University, Xi’an 710071, China;
(10) Scott Collins, Department of Diagnostic Radiology, Rhode Island Hospital, Providence, RI, 02903, USA and Warren Alpert Medical School of Brown University, Providence, RI, 02903, USA;
(11) Colin Greineder, MD, Department of Pharmacology, Medical School, University of Michigan, Ann Arbor, MI, 48109, USA;
(12) Sun H. Ahn, MD, Department of Diagnostic Radiology, Rhode Island Hospital, Providence, RI, 02903, USA and Warren Alpert Medical School of Brown University, Providence, RI, 02903, USA;
(13) Harrison X. Bai, MD, Department of Radiology and Radiological Sciences, Johns Hopkins University School of Medicine, Baltimore, MD, 21205, USA;
(14) Zhicheng Jiao, PhD, Department of Diagnostic Radiology, Rhode Island Hospital, Providence, RI, 02903, USA and Warren Alpert Medical School of Brown University, Providence, RI, 02903, USA;
(15) Michael K. Atalay, MD, PhD, Department of Diagnostic Radiology, Rhode Island Hospital, Providence, RI, 02903, USA and Warren Alpert Medical School of Brown University, Providence, RI, 02903, USA.
:::
:::info This paper is available on arxiv under CC BY 4.0 DEED license.
:::
\
You May Also Like

Woodway Assurance receives $1 million in funding for data privacy assurance solution EviData

Wormhole Unleashes W 2.0 Tokenomics for a Connected Blockchain Future
