

ZKJ Token Plummets More Than 60% in Flash Crash Amid Rug-Pull Allegations
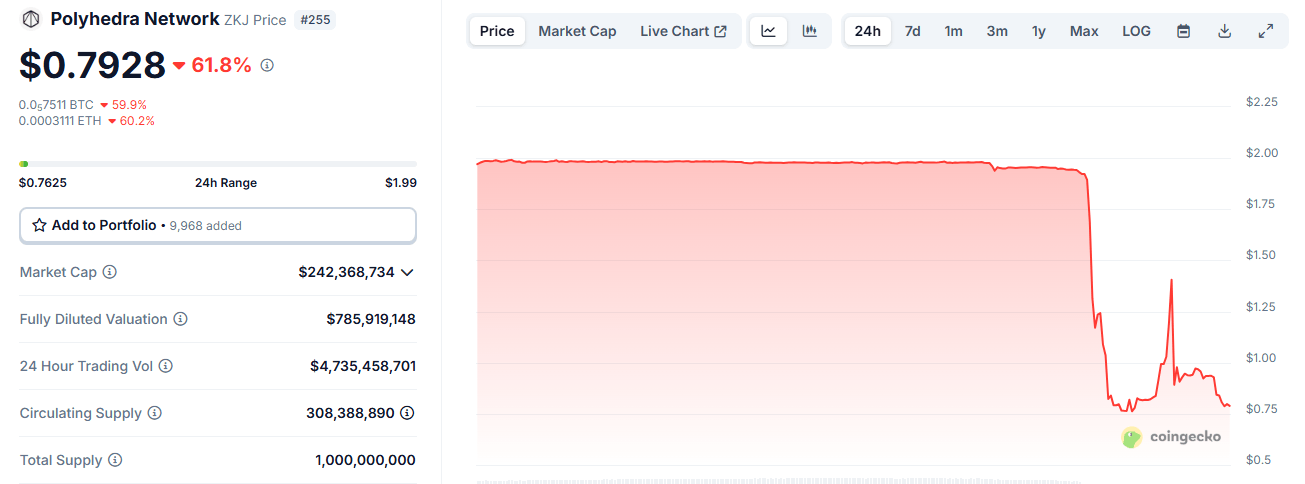
On June 15, ZKJ, the native token of Polyhedra Network, suffered a sudden and steep collapse, plunging more than 60% from $1.98 to a record low of $0.7625 in just under two hours.
ZKJ Revival Short-Lived
On June 15, ZKJ, the native token of Polyhedra Network, suffered a flash crash, plummeting by more than 60% in less than two hours. What began as a sudden drop from $1.98 cascaded to an all-time low of $0.7625, according to Coingecko data. While the token showed a fleeting sign of recovery, briefly surging to $1.41, this rally proved short-lived. At the time of writing ( June 15, 12:40 p.m. EST), the Polyhedra Network native token had retreated once more, languishing just below the $0.80 mark.
Coinmarketcap data painted an even bleaker picture, indicating a staggering 80% freefall for Polyhedra Network’s token, which nosedived from approximately $1.94 to a jarring $0.33. This plunge decimated the token’s market capitalization, bringing it down to a meager $94.76 million at the time of writing.
The collapse was particularly striking given ZKJ’s prior stability. For more than 30 days, the token had traded within a narrow band of $2.05 and $1.98, establishing itself as one of the less volatile tokens in a notoriously unpredictable market.
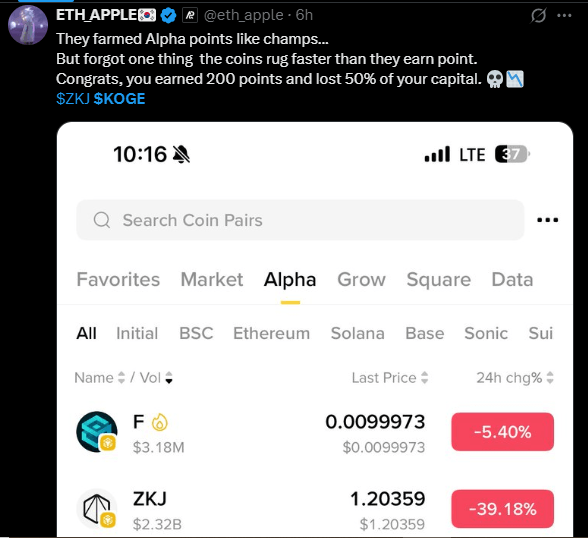
Meanwhile, the synchronized crash of ZKJ and KOGE sparked widespread speculation, with one prominent X user, ETH APPLE, pointing to a potentially “long-planned harvesting operation” as the cause. KOGE, mirroring Polyhedra Network’s native token, experienced its own plunge following the alleged draining of its liquidity pool.
“The issue began when the KOGE pool ran out of USDT, leaving LPs unable to exit positions,” stated ETH APPLE. “This led to a mass sell-off of KOGE into ZKJ, causing both tokens to crash. The situation worsened as it was revealed that the KOGE team hadn’t added any USDT to the pool.”
The alleged draining of liquidity has in turn fueled rug-pull accusations from the distressed community. Although ZKJ was reportedly “actively defending its USDT pool,” it ultimately found itself caught in the crossfire, its value dragged down by the unfolding chaos, as further detailed by ETH APPLE.
You May Also Like

Bitcoin ETFs Surge with 20,685 BTC Inflows, Marking Strongest Week

XAG/USD retreats toward $113.00 on profit-taking pressure
