

Momentum Check: Can XDC Network Charge Back to Its Recent Highs, or Is a Pullback in Play?
- XDC Network is currently trading at $0.050.
- Daily trading volume has surged by over 36%.
The crypto market’s prolonged bearish fear is gaining more traction day by day, which has pulled down the total market cap toward $2.95 trillion. Meanwhile, most of the major assets are losing momentum, sliding back to their former lows. Among them, XDC Network (XDC) has posted a gain of over 3.74%.
The asset has opened the day trading at a bottom level of $0.0486. Later, with the brief bullish shift, XDC rose to a high of $0.05136. Upon the active bulls getting more power to go higher, the price movement of the asset would gain momentum and trade on the upside to enter the uncharted territory.
According to the CoinMarketCap data, at the time of writing, XDC Network trades at around the $0.05031 zone, with its market cap touching $929.85 million. In addition, the daily trading volume of the asset has increased by over 36.02%, reaching the $39.14 million mark.
Is XDC Network Able to Keep the Momentum Going?
The 4-hour trading pattern exhibits a positive outlook and might climb to the resistance at the $0.05041 range. An extended gain could trigger XDC Network to sustain the bullish momentum and gradually send the price toward $0.05051 or even higher.
On the downside, the wake of bearish pressure can pose risks and could pull back the XDC Network price toward $0.05021. A steady breakdown from this level might strengthen the bears, and they would drive the price to its former low below $0.05011.
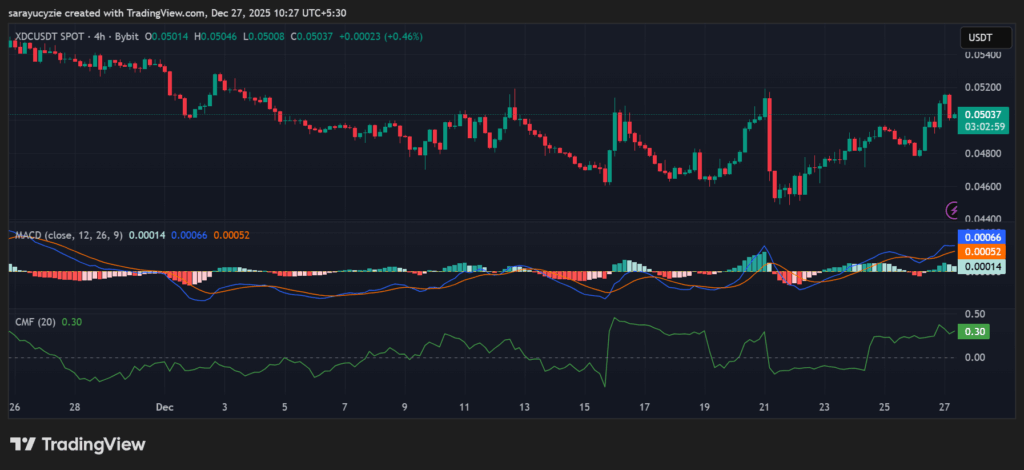 XDC chart (Source: TradingView)
XDC Network’s Moving Average Convergence Divergence (MACD) line is found above the signal line, which indicates bullish momentum, and the upward price movement may continue. Significantly, the Chaikin Money Flow (CMF) indicator is at 0.30, suggesting strong buying pressure in the XDC market. The capital is flowing into the asset. If it holds this level, it supports the bullish bias.
Moreover, the Bull Bear Power (BBP) reading of XDC at 0.00103 is slightly positive, hinting at a very mild bullish bias. Therefore, the momentum is weak, not decisive. XDC Network’s daily Relative Strength Index (RSI) found at 58.51 is pointing at moderate bullish sentiment. The asset is not overbought, but if it rises further, the bullish strength builds; a drop below 50 weakens the momentum.
Top Updated Crypto News
Ethereum Whales Take Opposing Accumulation Bets as 40% of Supply Stays in Loss
You May Also Like

Michael Saylor: “All the Capital in the World Is Going to Flow Into the Bitcoin Network”

14 of the Top 25 U.S. Banks Are Building Bitcoin Products
