AAVE Price Forecast: AAVE Could Hit $157-$146 Support Zone as Whale Selling Surges

Highlights:
- The Aave price has dropped 10% to $159, as the bearish grip tightens in the market.
- Lookonchain data has revealed that whale wallets are offloading the AAVE token, leading to the short-term dip.
- The technical outlook shows intense selling bearish as bears as AAVE could hit $156-$147 support zones.
The Aave (AAVE) price is seeing a short-term dip, trading at $159, marking a 10% plunge in the past 24 hours. Despite the fall, its daily trading volume has spiked by about 229%, indicating heightened market activity. According to on-chain data, the whale wallets are selling more tokens, and the momentum indicators of AAVE are becoming more negative. This means that in the next days, the Aave could hit $156-$147 support zones if it continues the downward movement.
On the other hand, the Lookonchain data on Monday has revealed that a whale wallet sold 230,350 AAVE valued at $37.8 million, putting more pressure to sell in the AAVE token. This is what has resulted in the wide 10% dump in the AAVE price.
Also, the Network Realized Profit/Loss (NPL) metric by Santiment shows that the profit-taking activity of Aave is at its highest since the end of November.
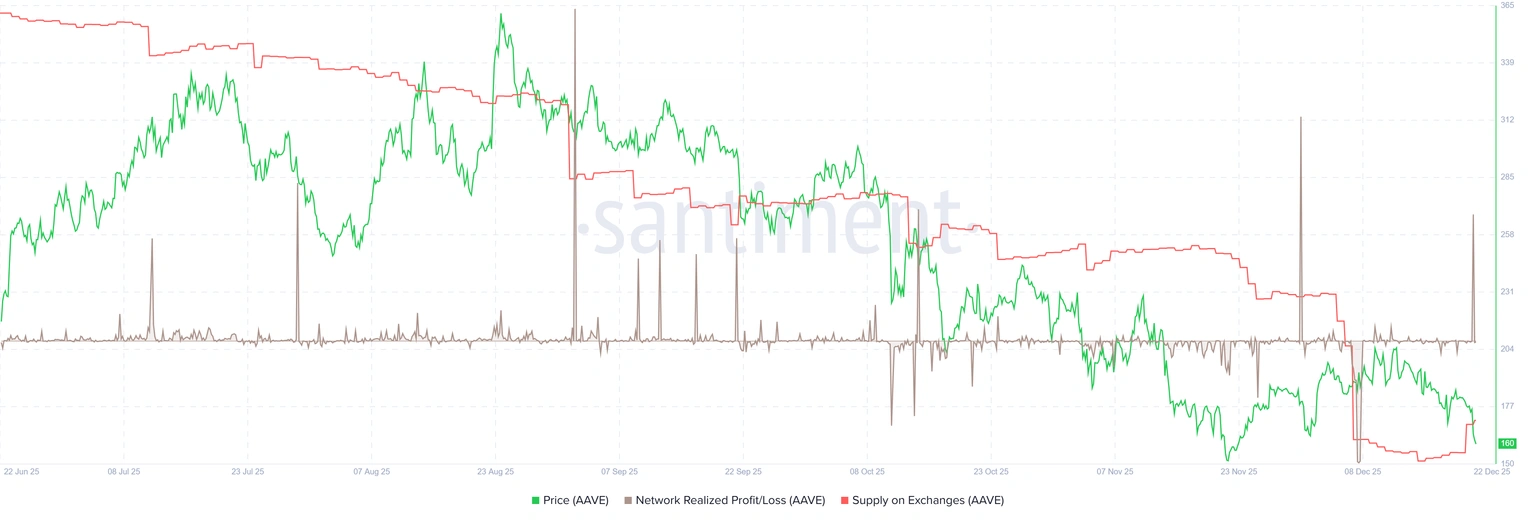 AAVE Network Realized Profit/Loss: Santiment
As the chart depicts, the metric shot up on Monday, which shows that the holders are, on average, selling their bags, resulting in tremendous profits. This, in turn, exacerbates selling pressure in AAVE.
AAVE Price Could Hit Support as Bearish Grip Strengthens
The AAVE daily chart price has broken down from important support near $204. The sellers have quickly pushed the price through the 50-day Simple Moving Average (SMA) at $186 and the 200-day SMA at $257, both turning into resistance.
The AAVE token is currently trading within a falling parallel channel, intensifying the bearish outlook. The next major support zone is between $156 and $147, as shown in the daily chart. This area saw strong buy interest earlier and could attract new buyers if the price stabilizes.
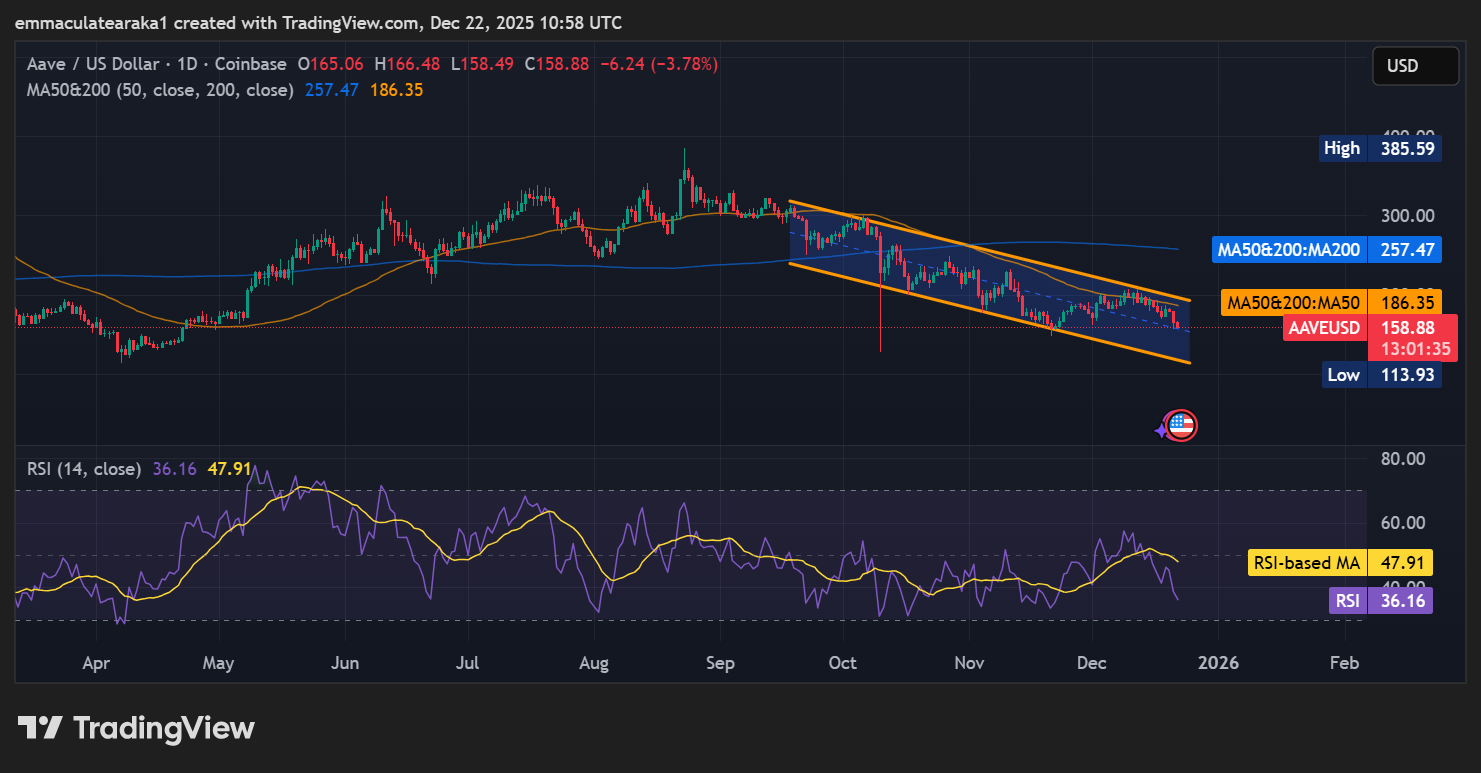 AAVE/USD 1-day chart: TradingView
Momentum indicators lean cautious rather than outright oversold. The RSI is sitting in the high‑30s, at 36.16, which indicates weak bullish strength. However, it also leaves room for a relief rebound if fresh buyers step in. The MACD has crossed below the signal line and remains in negative territory, confirming that sellers still control the trend.
In the short term, if the AAVE price loses support at $156, the next downside target could be the lower horizontal area near $147, where the last major accumulation zone formed before the previous rally.
However, if the $156 support holds, AAVE could attempt a recovery back toward initial resistance around the $186 mark, aligning with the 50-day MA. Further, a weekly close above that level would be the first sign that the downtrend is ending, potentially opening a path toward $200-$257 zones. Meanwhile, the next few days of trading will be crucial for deciding whether the AAVE price can finally stabilize or whether the downtrend continues.
eToro Platform
Best Crypto Exchange
- Over 90 top cryptos to trade
- Regulated by top-tier entities
- User-friendly trading app
- 30+ million users
eToro is a multi-asset investment platform. The value of your investments may go up or down. Your capital is at risk. Don’t invest unless you’re prepared to lose all the money you invest. This is a high-risk investment, and you should not expect to be protected if something goes wrong.
You May Also Like
Why Is Crypto Up Today? – December 4, 2025

Layer Brett Picked As The Best Crypto To Buy Now By Experts Over Pi Coin & VeChain