

Using Gold Futures on MEXC as a Hedge: What Correlation With the S&P 500 Actually Tells You
Excutive Summary:
What Changed in Early 2026: Why “Gold = Safe Haven” Isn’t the Full Story
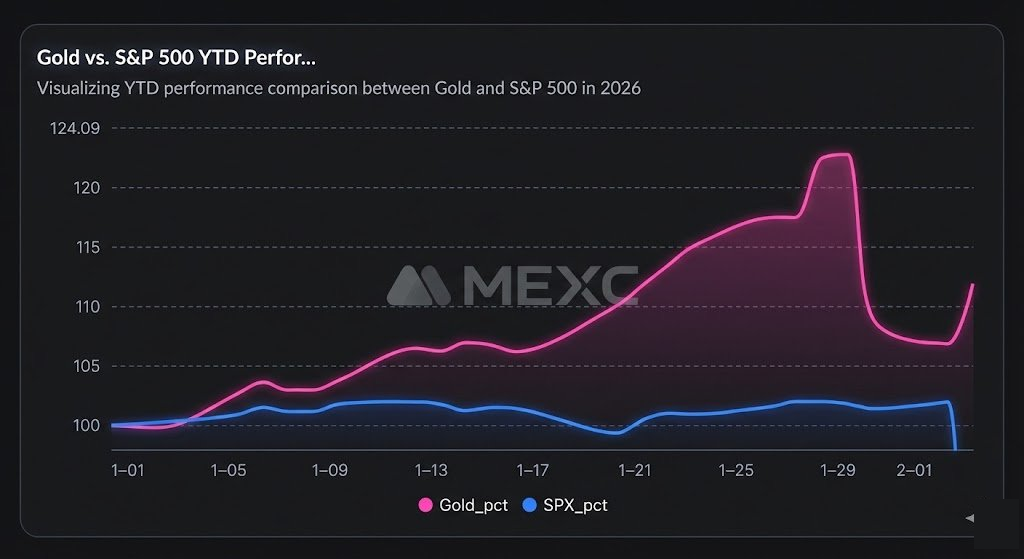
Correlation: Why Rolling Correlation Matters More Than Annual Correlation
30-day average correlation | +0.08 |
Latest 30-day correlation (as of Feb 2, 2026) | +0.13 |
Correlation range | -0.04 to +0.13 |
Stress Window: Late-January Drawdown (Jan 28 → Jan 30)
Metric | Gold (XAU) | S&P 500 (^GSPC) | Notes |
Jan 28 Close | 5,301.60 | 6,978.03 | Baseline for this window |
Jan 30 Close | 4,713.90 | 6,939.03 | Window low (as used here) |
Change (Jan 28 → Jan 30) | -11.09% | -0.56% | Equity drawdown was limited in this 2-day window |
Feb 2 Close (as of) | 4,622.50 | 6,976.44 | Not a “recovery” for gold vs Jan 28 baseline |
Trading XAUT Perpetual on MEXC: The Key Cost Is Funding, Not Just Fees
- Positive funding: longs pay shorts
- Negative funding: shorts pay longs
- Funding fee = Position value × Funding rate
- Funding fees can affect realized PnL, especially across multiple settlement intervals
Execution Snapshot (XAUT Perp) — 2026-02-03 16:40 (UTC+8)
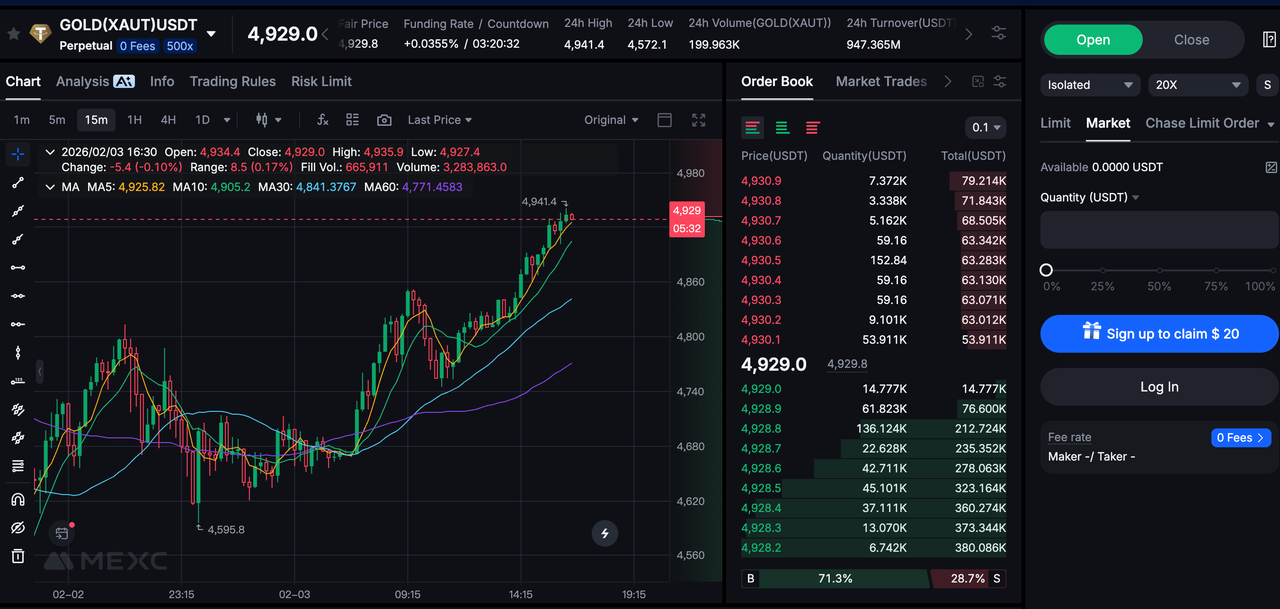
Trading Metric | Value |
Instrument | XAUT_USDT_PERP |
Last Price | 4932.3 |
Estimated Funding Rate | +0.0355% |
24h High / Low | 4941.4 / 4,572.1 |
24h Turnover (USDT) | 947,106,000 |
24h Volume (XAUT) | 199,917 |
Maker / Taker Fee | 0% / 0% |
Source | MEXC |
Summary
Key Points
- Gold perpetuals are better treated as a diversifier, not a mechanical inverse hedge to the S&P 500.
- 30-day rolling correlation in the sample window stayed near zero, reflecting more independent price behavior.
- In the Jan 28 → Jan 30 stress window, gold fell much more than the S&P 500, showing limited hedge behavior in that episode.
- For multi-interval holds, funding is a core carry-cost variable, not just trading fees.
Popular Articles

The Next Crypto Narrative: Why Payments and Utility Are Replacing Layer 1 Hype
Crypto has cycled through several major phases of attention. Early market energy focused on Layer 1 ecosystems competing for speed, scale, and developer traction. That narrative dominated for years un

What Is Fartcoin? A Complete Guide to the Popular Meme Cryptocurrency
Are you curious about the cryptocurrency that's making headlines in the meme coin world? This comprehensive guide will introduce you to Fartcoin (FART), one of the most talked-about cryptocurrencies i

What is Solaxy (SOLX) Crypto? Complete Guide to Solana's Layer-2 Solution
In the rapidly evolving landscape of blockchain technology, scalability remains one of the most pressing challenges facing major networks today. This comprehensive guide explores Solaxy (SOLX), a grou
Why Institutional Traders Are Migrating to MEXC for Gold (XAU) & Silver (XAG)
In the high-stakes world of commodity derivatives, volume tells the truth. It is the ultimate proxy for trust, depth, and reliability.While the crypto market remains volatile, a significant shift is o
Related Articles
The Next Crypto Narrative: Why Payments and Utility Are Replacing Layer 1 Hype
Crypto has cycled through several major phases of attention. Early market energy focused on Layer 1 ecosystems competing for speed, scale, and developer traction. That narrative dominated for years un
What Is Fartcoin? A Complete Guide to the Popular Meme Cryptocurrency
Are you curious about the cryptocurrency that's making headlines in the meme coin world? This comprehensive guide will introduce you to Fartcoin (FART), one of the most talked-about cryptocurrencies i
What is Solaxy (SOLX) Crypto? Complete Guide to Solana's Layer-2 Solution
In the rapidly evolving landscape of blockchain technology, scalability remains one of the most pressing challenges facing major networks today. This comprehensive guide explores Solaxy (SOLX), a grou
Why Institutional Traders Are Migrating to MEXC for Gold (XAU) & Silver (XAG)
In the high-stakes world of commodity derivatives, volume tells the truth. It is the ultimate proxy for trust, depth, and reliability.While the crypto market remains volatile, a significant shift is o
